We are in the process of migrating all NASA Earth science data sites into Earthdata from now until end of 2026. Not all NASA Earth science data and resources will appear here until then. Thank you for your patience as we make this transition.
Read about the Web Unification Project
Natural Hazards Data Access and Tools
From discovery to visualization, data tools such as the SEDAC Hazards Mapper and NASA's Flooding Days Projection Tool guide users in making the most of natural hazards data.
Natural Hazards Datasets
| Dataset Sort descending | Version | Platform | Instrument | Temporal Extent | Spatial Extent | Spatial Resolution | Data Format |
|---|---|---|---|---|---|---|---|
| MODIS/Terra+Aqua Direct Broadcast Burned Area Monthly L3 Global 500m SIN Grid V061 | 061 | Terra, Aqua | MODIS | 2000-11-01 to Present |
N: 90 S: -90 E: 180 W: -180 |
500 Meters x 500 Meters | HDF-EOS2 |
| MSAQSO2L4 version 1 is superseded by newer version, DOI: 10.5067/MEASURES/SO2/DATA406 | 1 | Aura, Suomi-NPP, Nimbus-7, EP-TOMS | OMI, OMPS, TOMS | 2005-01-01 to 2018-12-31 |
N: 90 S: -90 E: 180 W: -180 |
||
| Multi-Satellite Air Quality Sulfur Dioxide (SO2) Database Long-Term L4 Global V2 (MSAQSO2L4) at GES DISC | 2 | Aura, Suomi-NPP, Sentinel-5P, NOAA-20 | OMI, OMPS, TROPOMI | 2005-01-01 to 2024-12-31 |
N: 90 S: -90 E: 180 W: -180 |
||
| Multi-Satellite Volcanic Sulfur Dioxide L4 Long-Term Global Database V4 (MSVOLSO2L4) at GES DISC | 4 | Meteor-3, Aura, Suomi-NPP, Nimbus-7, EP-TOMS, Aqua, ADEOS-II, Sentinel-5P, NOAA-20 | TOMS, OMI, OMPS, AIRS, TROPOMI | 1978-10-31 to 2025-03-17 |
N: 90 S: -90 E: 180 W: -180 |
||
| NACP: Forest Carbon Stocks, Fluxes and Productivity Estimates, Western USA, 1979-2099 | 1 | MODELS | Computer | 1979-01-01 to 2099-12-31 |
N: 49.0351 S: 31.1875 E: -101.961 W: -124.812 |
netCDF-4 classic | |
| NACP Regional: Gridded 1-deg Observation Data and Biosphere and Inverse Model Outputs | 1 | Terra, Aqua | MODIS | 1990-01-01 to 2007-12-31 |
N: 84 S: 10 E: -50 W: -170 |
Shapefile | |
| NAFD-ATT Forest Canopy Cover Loss from Landsat, CONUS, 1986-2010 | 1 | LANDSAT-5, LANDSAT-7, MODELS | TM, ETM+, Computer | 1986-06-01 to 2010-09-15 |
N: 51.6785 S: 22.6911 E: -65.2025 W: -128.029 |
GeoTIFF | |
| OMPS/NPP PCA SO2 Total Column 1-Orbit L2 Swath 50x50km V2 (OMPS_NPP_NMSO2_PCA_L2) at GES DISC | 2 | Suomi-NPP | OMPS | 2012-01-26 to Present |
N: 90 S: -90 E: 180 W: -180 |
||
| Post-fire Recovery of Soil Organic Layer Carbon in Canadian Boreal Forests, 2015-2018 | 1 | FIELD SURVEYS | VISUAL OBSERVATIONS, CHN ANALYZERS, CORING DEVICES | 2015-06-11 to 2018-08-24 |
N: 68.3256 S: 59.7883 E: -104.194 W: -132.671 |
CSV | |
| Remote Sensing Data Before and After California Rim and King Forest Fires, 2010-2015 | 1 | NASA ER-2 | NEAR-INFRARED SPECTROMETER, LIDAR, AVIRIS | 2010-07-21 to 2015-01-15 |
N: 39.2193 S: 37.657 E: -119.57 W: -120.81 |
GeoTIFF | |
| SAFARI 2000 Emissions Estimates, MODIS Burned Area Product, Dry Season 2000 | 1 | Terra | MODIS | 2000-08-31 to 2000-09-30 |
N: 0.3389 S: -34.1425 E: 46.6473 W: 9.6738 |
Shapefile | |
| SAFARI 2000 Global Burned Area Map, 1-km, Southern Africa, 2000 | 1 | SPOT-4 | MULTI-SPECTRAL | 2000-01-01 to 2000-12-31 |
N: 18 S: -35 E: 55 W: -18 |
Shapefile | |
| SAFARI 2000 Historical Fire Maps, Kruger National Park, 1992-2001 | 1 | NOT APPLICABLE | NOT APPLICABLE | 1992-05-11 to 2001-03-31 |
N: -22.327 S: -25.529 E: 32.034 W: 30.888 |
Shapefile | |
| Sea Level Rise Impacts on Ramsar Wetlands of International Importance | 1.0 | MODELS | Computer | 2000-01-01 to 2010-12-31 |
N: 85 S: -58 E: 180 W: -180 |
Excel, WMS | |
| Simulated Fine Particulate Matter (PM2.5) Estimates over Alaska, 2001-2015 | 1 | COMPUTERS | Computer | 2001-05-10 to 2015-09-28 |
N: 71 S: 51 E: -128 W: -178 |
COG | |
| Sub-global Scenarios that Extend the Global SSP Narratives: Literature Database, Version 1, 2014-2021 | 1.00 | MODELS | Computer | 2014-01-01 to 2021-12-31 |
N: 90 S: -90 E: 180 W: -180 |
Excel | |
| TOMS/N7 MS SO2 Vertical Column 1-Orbit L2 Swath 50x50 km V3 (TOMSN7SO2) at GES DISC | 3 | Nimbus-7 | TOMS | 1978-11-01 to 1993-05-07 |
N: 90 S: -90 E: 180 W: -180 |
50 Kilometers x 50 Kilometers | |
| Tree Mortality from Fires and Bark Beetles at 1-km Resolution, Western USA, 2003-2012 | 1.1 | FIELD SURVEYS, Airplane, COMPUTERS, SATELLITES | VISUAL OBSERVATIONS, Computer, QUICKBIRD/BHRC-60 | 2003-01-01 to 2012-12-31 |
N: 52.0938 S: 28.4705 E: -100.538 W: -130.435 |
GeoTIFF | |
| Understory Vegetation Biomass from Selected Burned and Unburned sites in Alaska | 1 | FIELD SURVEYS | SURVEYING TOOLS | 2016-08-09 to 2018-07-11 |
N: 68.991 S: 63.8799 E: -146.558 W: -150.28 |
CSV | |
| U.S. Climate Risk Projections by County, 2040-2049 | 1.00 | MODELS | Computer | 2040-01-01 to 2049-12-31 |
N: 72 S: 17 E: -65 W: -180 |
Shapefile, PDF, PNG, Excel | |
| U.S. Population Grids (Summary File 1), 2000: Alabama, Louisiana, Mississippi and Texas, Alpha Version | alpha | MODELS | Computer | 2000-04-01 |
N: 36 S: 28 E: -84 W: -95 |
Grid | |
| U.S. Population Grids (Summary File 1), 2000: Houston Metropolitan Statistical Area, Alpha Version | alpha | MODELS | Computer | 2000-04-01 |
N: 31 S: 28 E: -94 W: -97 |
Grid, PDF, PNG | |
| U.S. Population Grids (Summary File 1), 2000: New Orleans Metropolitan Statistical Area, Alpha Version | alpha | MODELS | Computer | 2000-04-01 |
N: 31 S: 28 E: -88 W: -91 |
Grid, PDF, PNG | |
| U.S. Population Grids (Summary File 3), 2000: Alabama, Louisiana, and Mississippi, Alpha Version | alpha | MODELS | Computer | 2000-04-01 |
N: 36 S: 28 E: -84 W: -95 |
Grid | |
| VIIRS/JPSS1+JPSS2 Global Flood Product L3 NRT 250m 1-day CS GeoTIFF | 2 | NOAA-20, NOAA-21, Suomi-NPP | VIIRS | 2026-03-04 to Present |
N: 90 S: -90 E: 180 W: -180 |
250 Meters x 250 Meters | GeoTIFF |
Featured Observation Method: VIIRS
NASA's Visible Infrared Imaging Radiometer Suite (VIIRS) provides active data for fire management and wildfire alert systems.

Learn how to use NASA's Fire Information for Resource Management System (FIRMS) and its enhanced User Interface that provides additional services and analysis capabilities for wildfire management.
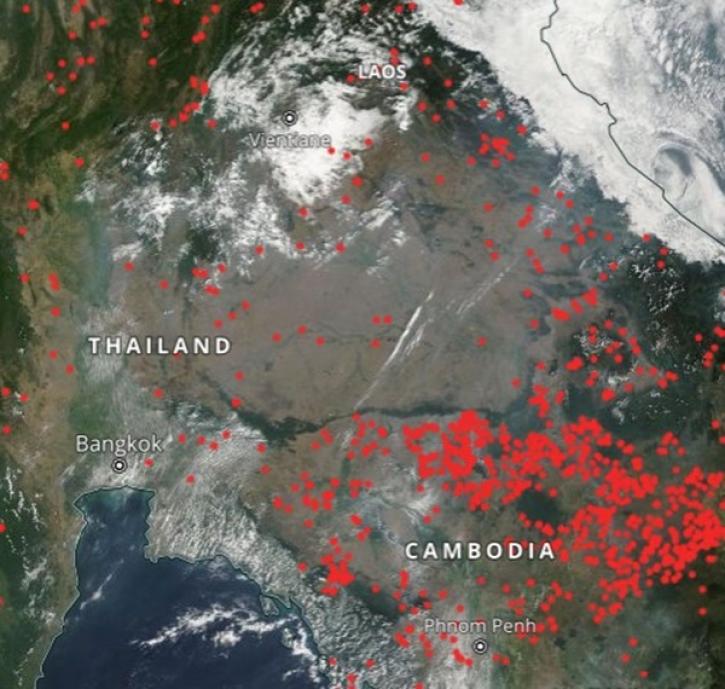
Geographer Veerachai Tanpipat promotes the use of NASA's Fire Information for Resource Management System (FIRMS) throughout the Lower Mekong River Region.
9 MIN READ

NASA’s worldwide Fire Information for Resource Management System (FIRMS) provides vital near real-time tools for managing wildland fires.
7 MIN READ
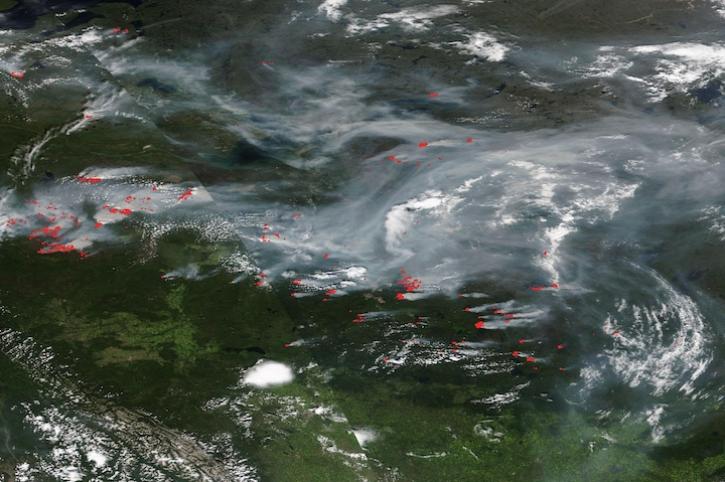
Image captured on July 17, 2024, by the VIIRS instrument aboard the joint NASA/NOAA NOAA-20 satellite.
Frequently Asked Questions
Earthdata Forum
Our online forum provides a space for users to browse thousands of FAQs about research needs, data, and data applications. You can also submit new questions for our experts to answer.
Submit Questions to Earthdata Forumand View Expert Responses