We are in the process of migrating all NASA Earth science data sites into Earthdata from now until end of 2026. Not all NASA Earth science data and resources will appear here until then. Thank you for your patience as we make this transition.
Read about the Web Unification Project
Atmospheric Winds Data Access and Tools
NASA’s atmospheric wind data range from hourly primary forcing measurements to inter-related suites of atmospheric wind and other data. Our datasets and tools help users find and integrate the information they need to see how this primary weather force effects our lives and planet.
Atmospheric Winds Datasets
| Dataset Sort descending | Version | Platform | Instrument | Temporal Extent | Spatial Extent | Spatial Resolution | Data Format |
|---|---|---|---|---|---|---|---|
| SAFARI 2000 BVOC Measurements at Skukuza and Maun Flux Towers, Wet Season 2001 | 1 | LABORATORY, FIXED OBSERVATION STATIONS, FIELD INVESTIGATION | GC-MS, GAS CHROMATOGRAPHS, SONIC ANEMOMETER, PAR SENSORS, PHOTOSYNTHESIS CHAMBER, THERMOCOUPLES | 2001-02-01 to 2001-02-12 |
N: -19.9 S: -19.9 E: 23.55 W: 23.55 |
CSV | |
| SAFARI 2000 ETA Atmospheric Model Data, Wet and Dry Seasons 2000 | 1 | NOT APPLICABLE | NOT APPLICABLE | 2000-02-01 to 2000-09-30 |
N: -9 S: -53 E: 53 W: -13 |
Shapefile | |
| SAFARI 2000 Kalahari Transect CO2, Water Vapor, and Heat Flux, Wet Season 2000 | 1 | FIELD INVESTIGATION, FIXED OBSERVATION STATIONS | TDR, THERMOCOUPLES, SOIL HEAT FLUX TRANSDUCER, INFRARED THERMOMETERS, TEMPERATURE SENSORS, SONIC ANEMOMETER, IR CO2 ANALYZER, NET RADIOMETERS, HUMIDITY SENSORS | 2000-03-01 to 2000-03-19 |
N: -15.438 S: -24.164 E: 23.594 W: 21.713 |
Shapefile | |
| SAFARI 2000 Meteorological and Flux Tower Measurements in Maun, Botswana, 2000 | 1 | FIXED OBSERVATION STATIONS, FIELD INVESTIGATION | PYRANOMETERS, IRGA, PRESSURE TRANSDUCERS, TEMPERATURE PROBES, RTD, ANEMOMETERS, LICOR QUANTUM SENSOR, RAIN GAUGES, HUMIDITY SENSORS, SOIL MOISTURE PROBE, THERMOMETERS | 2000-02-01 to 2000-09-30 |
N: -19.9 S: -19.9 E: 23.55 W: 23.55 |
Shapefile | |
| SAFARI 2000 Meteorological Tower Measurements, Kruger National Park, 2000-2002 | 1 | FIXED OBSERVATION STATIONS | PYRANOMETERS, HUMIDITY SENSORS, RAIN GAUGES, WIND VANES, ANEMOMETERS, LICOR GAS EXCHANGE SYSTEM, TEMPERATURE PROBES | 2000-02-15 to 2002-12-31 |
N: -25.0197 S: -25.0197 E: 31.4969 W: 31.4969 |
Shapefile | |
| SAFARI 2000 Modeled Tropospheric Air Mass Trajectories, Dry Season 2000 | 1 | NOT APPLICABLE | NOT APPLICABLE | 2000-08-14 to 2000-09-23 |
N: -15.3 S: -30 E: 31 W: 17.1 |
Shapefile | |
| SAFARI 2000 MODIS Water and Heat Fluxes, Maun, Botswana, Dry Season 2001 | 1 | FIXED OBSERVATION STATIONS, FIELD INVESTIGATION, Terra, MODELS | PRESSURE SENSORS, WIND MONITOR, HUMIDITY SENSORS, NET RADIOMETERS, EDDY CORRELATION DEVICES, SOIL HEAT FLUX TRANSDUCER, MODIS, Computer | 2001-09-02 to 2001-09-29 |
N: -17.9946 S: -21.0004 E: 24.5004 W: 21.4946 |
Shapefile | |
| SAFARI 2000 Upper Air Meteorological Profiles, South Africa, Dry Season 2000 | 1 | BALLOONS | RADIOSONDES | 2000-08-01 to 2000-09-30 |
N: -24 S: -41 E: 31 W: -10 |
Shapefile | |
| Saildrone 2021 Arctic field campaign for the Multi-Sensor Improved SST (MISST) project | 1 | Saildrone | CTD, ADCP, ANEMOMETERS, FLUOROMETERS, TEMPERATURE SENSORS, HUMIDITY SENSORS, PYROMETERS, PAR SENSORS, BAROMETERS | 2021-07-06 to 2021-10-21 |
N: 71 S: 65 E: -164.5 W: -168 |
netCDF-4 | |
| Saildrone 2022 Arctic field campaign for the Multi-Sensor Improved SST (MISST) project | 1 | Saildrone | CTD, ADCP, ANEMOMETERS, FLUOROMETERS, TEMPERATURE SENSORS, HUMIDITY SENSORS, PYROMETERS, PAR SENSORS, BAROMETERS | 2022-06-18 to 2022-08-17 |
N: 71.6 S: 65.2 E: -157.2 W: -168.5 |
netCDF-4 | |
| Saildrone Arctic field campaign surface and ADCP measurements for NOPP-MISST project | 1.0 | Saildrone | PYROMETERS, ADCP, CTD, ANEMOMETERS, FLUOROMETERS, BAROMETERS | 2019-05-14 to 2019-10-11 |
N: 75.5 S: 53.8 E: -146.1 W: -168.7 |
netCDF-4 | |
| Saildrone field campaign surface and ADCP measurements for the Atlantic Tradewind Ocean-Atmosphere Mesoscale Interaction Campaign (ATOMIC) project | 1.0 | Saildrone | PYROMETERS, ADCP, CTD, ANEMOMETERS, FLUOROMETERS, BAROMETERS | 2020-01-17 to 2020-03-02 |
N: 12.1 S: 7.4 E: -48.6 W: -59.4 |
netCDF-4 | |
| SASS (Subsonics Assessment) Ozone and NOx Experiment (SONEX) Ancillary Data | 1 | CLIMATE MODELS | Computer | 1997-10-07 to 1997-11-13 | GIF, EPS | ||
| SASS (Subsonics Assessment) Ozone and NOx Experiment (SONEX) DC-8 In-Situ Meteorological and Navigation Data | 1 | NASA DC-8 | MMS, MTP, DLH, DADS | 1997-10-07 to 1997-11-13 | AMES | ||
| SASS (Subsonics Assessment) Ozone and NOx Experiment (SONEX) Merge Data Files | 1 | NASA DC-8 | DADS, MMS, MTP, CNC, TSI CNC-3760, WAS, ATHOS, CHEMILUMINESCENCE, FSSP, PCASP, DACOM, LICOR GAS EXCHANGE SYSTEM, DLH, SAFS, CIMS | 1997-10-07 to 1997-11-12 | AMES | ||
| SASS (Subsonics Assessment) Ozone and NOx Experiment (SONEX) Satellite Data | 1 | EP-TOMS, GOES-8 | TOMS, GOES-8 Imager | 1997-08-14 to 1997-11-17 | GIF, EPS | ||
| SASSIE Arctic Field Campaign Jet Surface Salinity Profiler Data Fall 2022 Version 1 | 1 | ROVS | CTD, WIND MONITOR, TEMPERATURE SENSORS, PRESSURE SENSORS | 2022-09-10 to 2022-09-26 |
N: 73.5 S: 72 E: -144 W: -151 |
netCDF-4 | |
| SASSIE Arctic Field Campaign L1 Wave Glider Data Fall 2022 | 1 | Wave Glider | ADCP, CTD, WAVE HEIGHT GAUGES, ANEMOMETERS, BAROMETERS, THERMOMETERS | 2022-08-01 to 2022-10-31 |
N: 75.75 S: 67.46 E: -138 W: -170.5 |
tar.gz | |
| SASSIE Arctic Field Campaign Shipboard Meteorology Data Fall 2022 | 1 | Ships | PYRANOMETERS, SONIC ANEMOMETER, Pyrgeometer | 2022-08-06 to 2022-10-01 |
N: 73.55 S: 69 E: -144.8 W: -166 |
NetCDF-4 | |
| SASSIE ECCO Atmosphere Surface Temperature, Humidity, and Wind - Daily Mean llc1080 Grid (Version 1 Release 1) | V1R1 | MITgcm | 2014-01-15 to 2021-02-08 | NETCDF4 | |||
| SBU Meteorological Station IMPACTS V1 | 1 | GROUND STATIONS | ANEMOMETERS, BAROMETERS, GPS, HUMIDITY SENSORS, THERMOMETERS | 2020-01-01 to 2023-01-25 |
N: 43.256 S: 40.718 E: -73.02 W: -76.882 |
netCDF-4, ASCII | |
| SBU Mobile Soundings IMPACTS | 1 | GROUND STATIONS | RAWINSONDES | 2020-01-18 to 2023-02-28 |
N: 43.784980773926 S: 40.48413848877 E: -70.869209289551 W: -76.980628967285 |
netCDF-3 | |
| SCATSAT-1 ESDR Level 2 Ancillary Ocean Surface Fields Version 1.1 | 1.1 | MODELS, SCATSAT-1 | Computer, OSCAT-2 | 2018-04-01 to 2021-03-01 |
N: 90 S: -90 E: 180 W: -180 |
12.5 Kilometers x 12.5 Kilometers | netCDF-4 |
| SCOAPE Balloon and Ozonesondes Data | 1 | GROUND-BASED OBSERVATIONS | OZONESONDES, RADIOSONDES | 2019-05-11 to 2019-05-19 | ICARTT | ||
| SCOAPE R/V Point Sur Data | 1 | R/V Point Sur | CEILOMETERS, SUN PHOTOMETERS, AETHALOMETER, ANEMOMETERS, PYRANOMETERS | 2019-05-09 to 2019-05-19 | NetCDF-3, ICARTT |
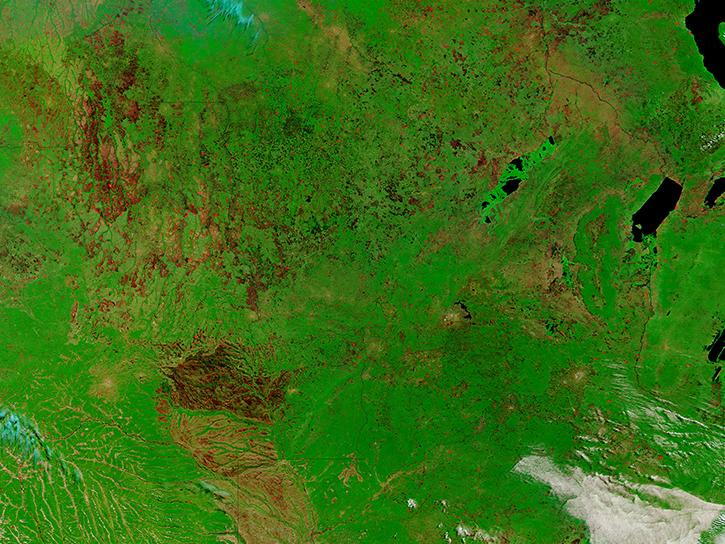
Featured Atmospheric Winds Observation Method: MODIS
The Moderate Resolution Imaging Spectroradiometer (MODIS) flies aboard the Terra and Aqua satellites and surveys Earth every one to two days. The multi-spectral instrument can be used in a variety of ways including detecting winds in different levels of the atmosphere.
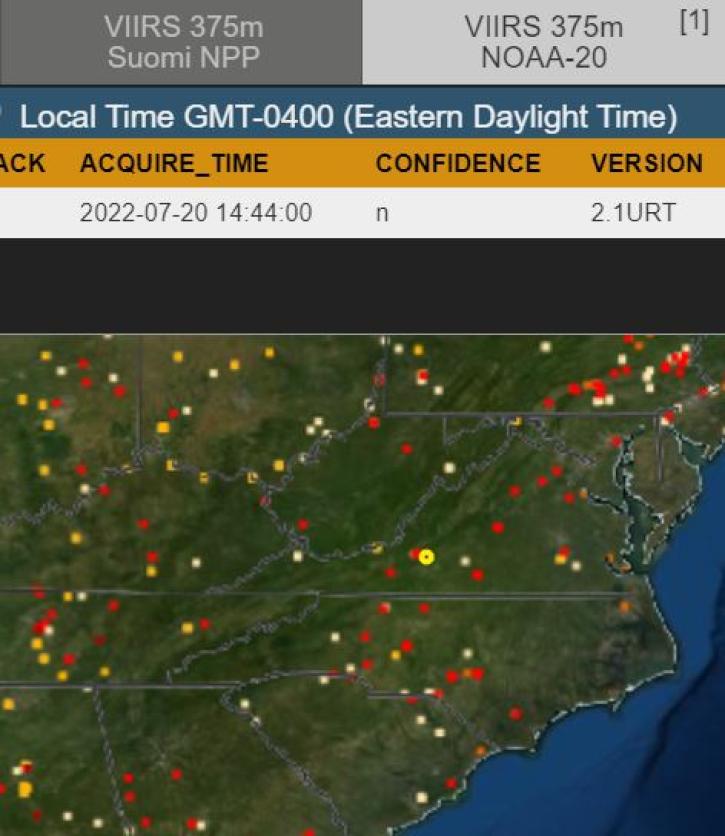
Scientists develop routine service for wildfire detection in the continental United States with a latency of less than 60 seconds.
6 MIN READ
Join us to learn how to discover, subset, access and visualize both MODIS and VIIRS data products using a suite of user-friendly tools developed by NASA's ORNL DAAC.

MODIS Terra Collection 6 Aerosol, Cloud, and other Atmospheric Level-2 and Level-3 Data
Learn how to access and use Moderate Resolution Imaging Spectroradiometer (MODIS) Version 6 land data.
Frequently Asked Questions
Earthdata Forum
Our online forum provides a space for users to browse thousands of FAQs about research needs, data, and data applications. You can also submit new questions for our experts to answer.
Submit Questions to Earthdata Forumand View Expert Responses