We are in the process of migrating all NASA Earth science data sites into Earthdata from now until end of 2026. Not all NASA Earth science data and resources will appear here until then. Thank you for your patience as we make this transition.
Read about the Web Unification Project
Filters

Image captured Mar 7, 2023, by the VIIRS instrument aboard the joint NASA/NOAA Suomi NPP satellite.
Worldview Image of the Week
March 8, 2023

Updated sea surface salinity data products fill an Earth observing need identified in the 2020 Satellite Needs Working Group (SNWG) survey of federal agencies.
News
March 7, 2023
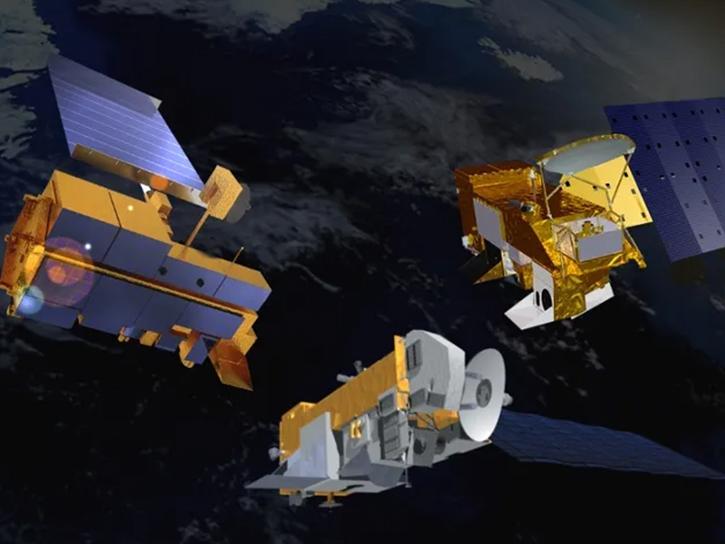
A new Request for Information (RFI) with responses due by April 4 seeks input for determining Terra, Aqua, and Aura mission data product continuity needs, capabilities, and gaps.
News
March 6, 2023
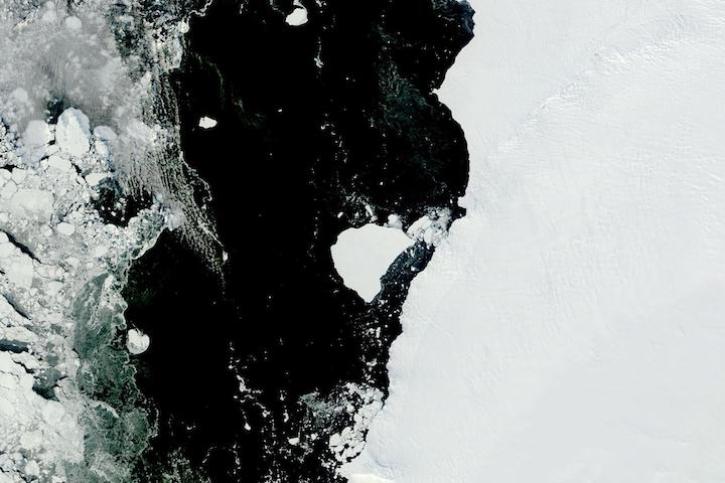
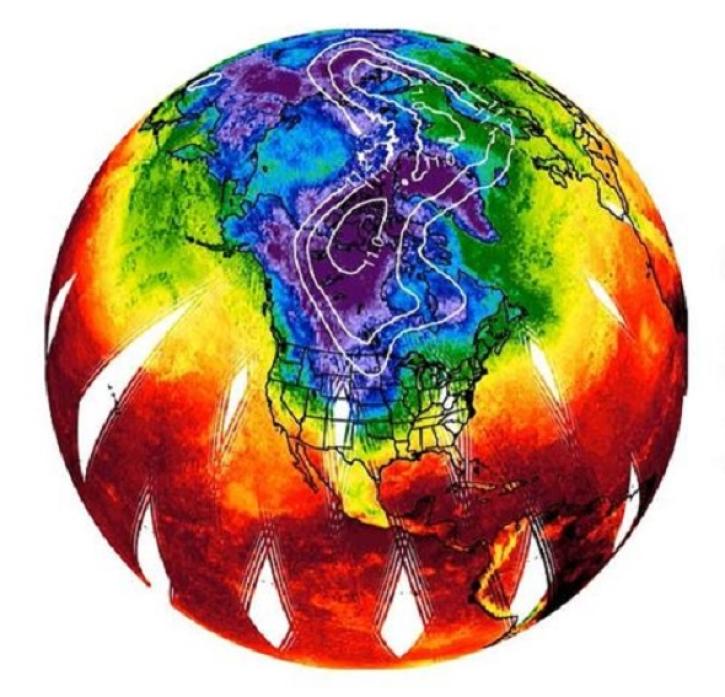
Image captured on Feb 28, 2023, by the MODIS instrument aboard NASA's Terra satellite.
Worldview Image of the Week
March 1, 2023

Satellite data reveals the impact of storm runoff on the coastal ocean.
Data in Action
March 1, 2023

Tools and services including PO.DAAC Drive, LAS, CWS, and THREDDS are retiring.
News
March 1, 2023

Data from NASA’s ORNL DAAC help Dr. Kyla Dahlin better understand how remote sensing can improve predictive ecological models.
Data User Story
Feb. 28, 2023
Next-generation instruments aboard Joint Polar Satellite System spacecraft provide continuity to the AIRS project that began in 2002.
Feature Article
Feb. 27, 2023
SHOWING 8 OF 2379