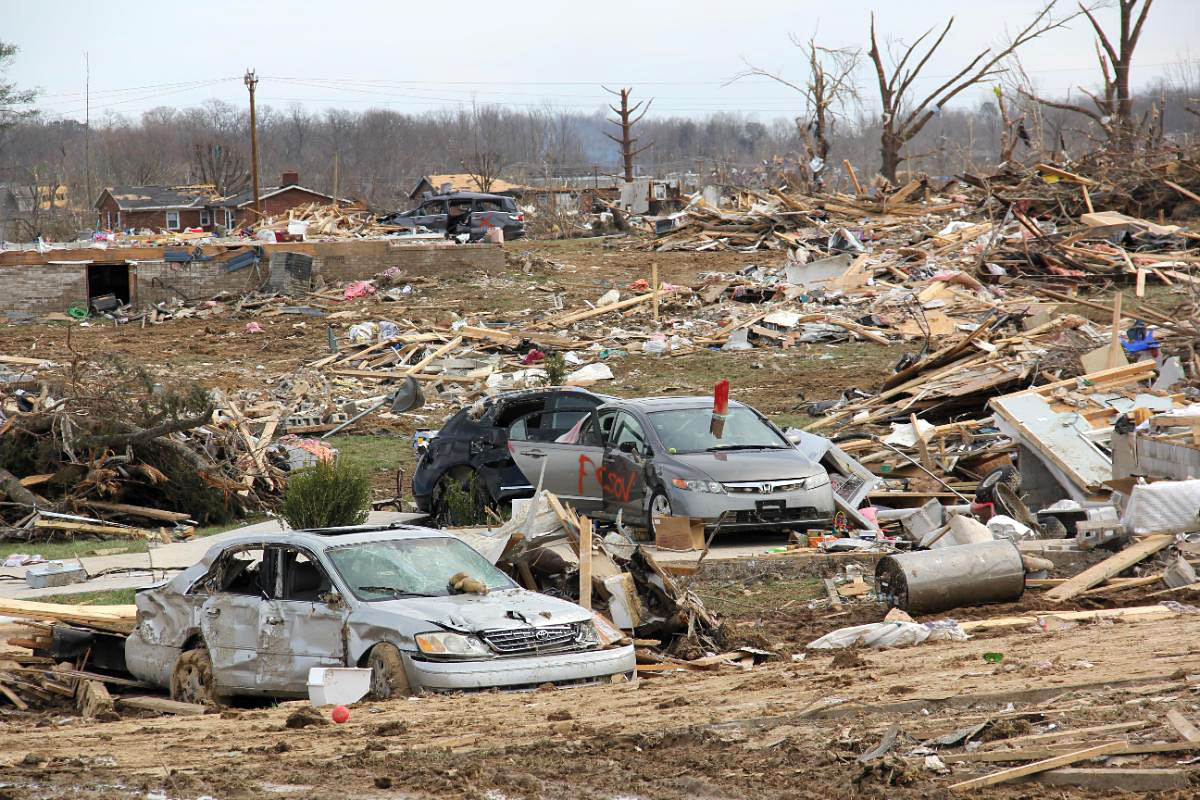
After a tornado moves through an area and the immediate emergencies are over, many people quickly begin to wonder exactly how strong the tornado was, where it went, and how much damage it left behind. Emergency managers need to understand the path of the tornado to begin to prioritize search-and-rescue and recovery efforts. Meteorologists want to know characteristics of the tornado damage—especially spatial extent and severity—as they try to improve tornado warnings through radar signatures and other remote sensing observations. Farmers need details on how bad the damage was so they can file a crop insurance claim. The list goes on.
The job of surveying a tornado track can be hampered by difficult terrain, bad weather, inaccessible locations, or multiple tornadoes crossing the same area. To make the complex task easier, remote sensing scientist Hannah Pankratz of NASA’s Marshall Space Flight Center–University of Alabama in Huntsville recently tried identifying tornado tracks using synthetic aperture radar (SAR) data from satellites. She found the technique could be a way to quickly provide a broad view of a tornado’s path of destruction.
“Tornadoes can be terrifying and lead to significant damage, and we're using SAR to try and help partners improve our ability to map and respond to the damage,” said Pankratz.
Tools for Assessing the Damage
After the severe weather event is over, the damage assessment soon begins.
“We need to figure out the degree of damage and the extent, and whether it was from a tornado, straight line winds, or a downburst,” said Kristopher White, lead forecaster for the National Weather Service's (NWS) Huntsville office.
As soon as reasonably possible, NWS forecasters like White go out into the community with a team of meteorologists to conduct ground surveys of the wreckage and to determine a tornado’s strength and path. The teams are often accompanied by local emergency managers, who have reports they’ve received from people affected by the storm. The survey process can last for days or even weeks for larger damage events.
The NWS categorizes tornadoes using the Enhanced Fujita (EF) scale to assess and rate the strength of tornadoes from EF 0-5. Each intensity rating includes a range of wind speeds that correspond with the degree of damage they cause natural and built surroundings. The ratings are based upon detailed engineering studies and other observations that definitively link the observed damage to buildings, homes, and other structures with the wind necessary to cause such damage. For example, an EF0 tornado creates broken branches and other light damage consistent with 65 to 85 mph winds. A rare EF5 can blow entire houses off their foundations with winds over 200 mph.
Meteorologists use various tools to survey the aftermath, including special GIS-enabled software for recording and assessing storm damage, remote controlled drones (often supplied by emergency managers or contractors), and satellite data. The satellite data often come from optical, light-sensing sensors such as the Operational Land Imager (OLI) aboard Landsat satellites, the Multispectral Instrument (MSI) imager on the European Space Agency’s (ESA) Sentinel-2 spacecraft, and other data available through NASA's Commercial Satellite Data Acquisition Program (CSDA).
OLI observations, for instance, can be used to create normalized difference vegetation index (NDVI) products, which measure an area’s greenness and can reveal trails of decaying trees and other plants damaged by a tornado. NDVI products, however, have their limits. For one thing, changes in greenness are only apparent when plants and trees are full of leaves, making tornado paths harder to spot in late fall, winter, or early spring. It can also take days to weeks before plants wither and die enough to be detected from space. And clouds can block an optical sensor’s view of the ground, potentially keeping researchers from gathering any data at all when it is needed the most.
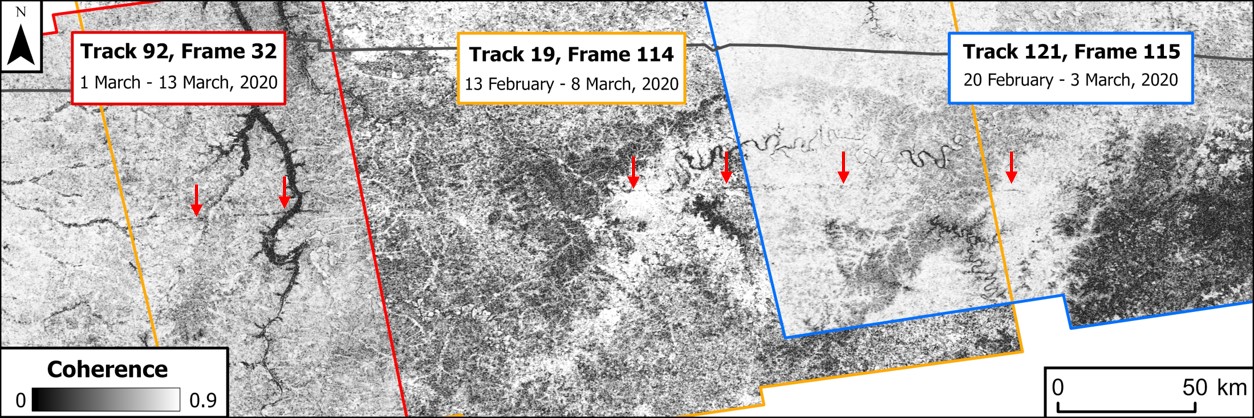
SAR, on the other hand, can detect changes immediately, acquiring data by day or night and in most weather conditions. Pankratz previously had success employing it in time-series analyses to measure subtle ground deformation from space. She was also aware of SAR being used in some other severe weather studies.
“SAR has previously been used to detect flooding, along with hail and wind damage,” said Pankratz. “I wanted to see if SAR’s specific ability to measure physical changes could be useful for identifying tornado tracks.”
Sensing the Changes
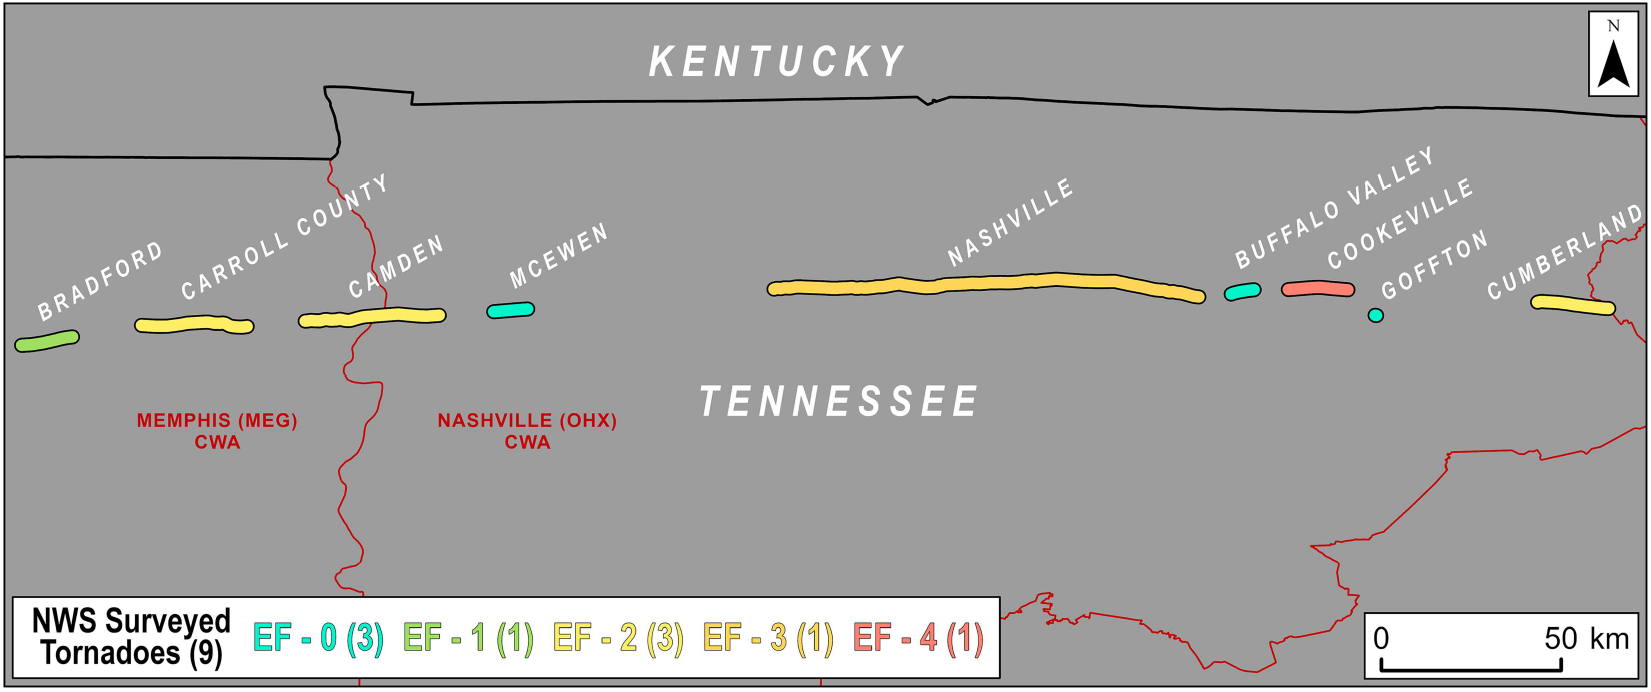
To test that application, Pankratz used SAR data from the ESA's Sentinel-1A satellite to identify tornado damage tracks from the March 2-3, 2020, outbreak in Tennessee. (The data were provided by ESA through a partnership with the Alaskan Satellite Facility Distributed Active Archive Center.) During the outbreak, a long-lived supercell thunderstorm blew eastward across the state, spawning 13 tornadoes and significant wind and hail across 10 counties. The storm produced a combined total of 128 miles of identified tornado tracks.
The study focused specifically on nine tornado tracks in the Memphis and Nashville areas because they were well-surveyed by the NWS and included a variety of EF ratings across a mixture of rural and urban areas.