We are in the process of migrating all NASA Earth science data sites into Earthdata from now until end of 2026. Not all NASA Earth science data and resources will appear here until then. Thank you for your patience as we make this transition.
Read about the Web Unification Project
Ocean Winds Data Access and Tools
NASA has ocean winds datasets that help researchers characterize the flow of air moving across the ocean. Access a range of data and data tools such as AppEEARS, Worldview, and Giovanni to make the most of ocean winds data.
Ocean Winds Datasets
| Dataset Sort descending | Version | Platforms | Instruments | Temporal Extent | Spatial Extent | Spatial Resolution | Data Format |
|---|---|---|---|---|---|---|---|
| Sentinel-1C Ocean Product Metadata | 1 | Sentinel-1C | C-SAR | 2025-03-28 to Present |
N: 90 S: -90 E: 180 W: -180 |
XML | |
| SMMR/Nimbus-7 Color Images V001 (SMMRN7IM) at GES DISC | 001 | Nimbus-7 | SMMR | 1978-10-30 to 1983-11-02 |
N: 90 S: -90 E: 180 W: -180 |
||
| SMODE L2 WAVEGLIDERS TEMP SALINITY V1 | 1 | Wave Glider | CTD, ADCP, MMS, CURRENT METERS | 2021-10-28 to 2023-05-14 |
N: 38.2 S: 36.3 E: -122.1 W: -126.2 |
netCDF-4 | |
| SMODE L3 WAVEGLIDERS TEMP SALINITY V1 | 1 | Wave Glider | CTD, ADCP, MMS, CURRENT METERS | 2022-09-20 to 2023-05-13 |
N: 38.2 S: 36.3 E: -122.1 W: -126.2 |
netCDF-4 | |
| SMODE Shipboard Windcube LiDAR Observations Version 1 | 1 | Ships | MMS, WindCube | 2022-10-01 to 2023-05-06 |
N: 38.1 S: 36.3 E: -122.9 W: -125.4 |
NetCDF | |
| SPURS-1 research vessel Meteorological series data for N. Atlantic Endeavor cruises | 1.0 | R/V Endeavor, R/V Knorr | MMS | 2013-03-14 to 2013-10-13 |
N: 42 S: 32 E: -37 W: -72 |
1 Meters x 1 Meters | netCDF-4 |
| SPURS-1 research vessel Thermosalinograph series data for N. Atlantic cruises | 1.0 | R/V Knorr, R/V Endeavor, R/V Thalassa, R/V Sarmiento | THERMOSALINOGRAPHS, SPURS_METEO | 2012-09-01 to 2013-10-13 |
N: 42 S: 20 E: -14 W: -73 |
1 Meters x 1 Meters | netCDF-4 |
| SPURS-2 Central mooring CTD, surface flux and meterorological data for the E. Tropical Pacific field campaign | 1.0 | Mooring | CTD, MMS | 2016-08-16 to 2017-11-16 |
N: 10.05 S: 10.05 E: -125.03 W: -125.03 |
1 Meters x 1 Meters | netCDF-4 |
| SPURS-2 Passive Accoustic Listener (PAL) data from ARGO float deployments during the E. Tropical Pacific field campaign | 1.0 | ARGO | HUMIDITY SENSORS | 2016-08-25 to 2018-08-22 |
N: 12.106 S: 8.861 E: -116.57 W: -129.129 |
1 Meters x 1 Meters | netCDF-4 |
| SPURS-2 Rawinsonde meteorological data for the E. Tropical Pacific field campaign R/V Revelle cruises | 1.0 | RAWINSONDES | WIND PROFILERS, TEMPERATURE SENSORS, HUMIDITY SENSORS | 2016-08-20 to 2017-11-10 |
N: 12.35 S: 5.139 E: -123.32 W: -133.216 |
1 Meters x 1 Meters | netCDF-4 |
SHOWING 10 OF 263
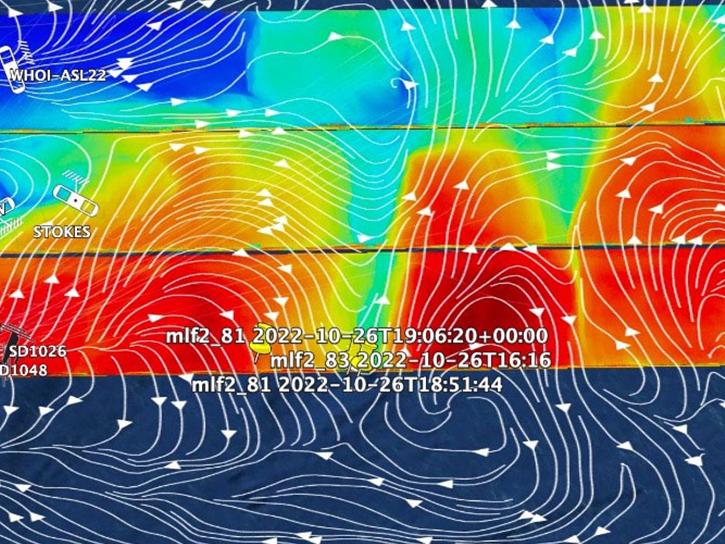
Featured Ocean Winds Observation Method: S-MODE
The Sub-Mesoscale Ocean Dynamics Experiment (S-MODE) was a NASA campaign studying small-scale ocean eddies and fronts. S-MODE consisted of three deployments off the coast of San Francisco during the fall of 2021-2022 and spring of 2023. Airborne measurements were taken with different remote instruments including the Doppler Scatterometry (DopplerScatt), Multiscale Observing System of the Ocean Surface (MOSES), Modular Aerial Sensing System (MASS), and Portable Remote Imaging SpectroMeter (PRISM). In-situ measurements were obtained through research vessels, gliders, drifters, and other water-based platforms.
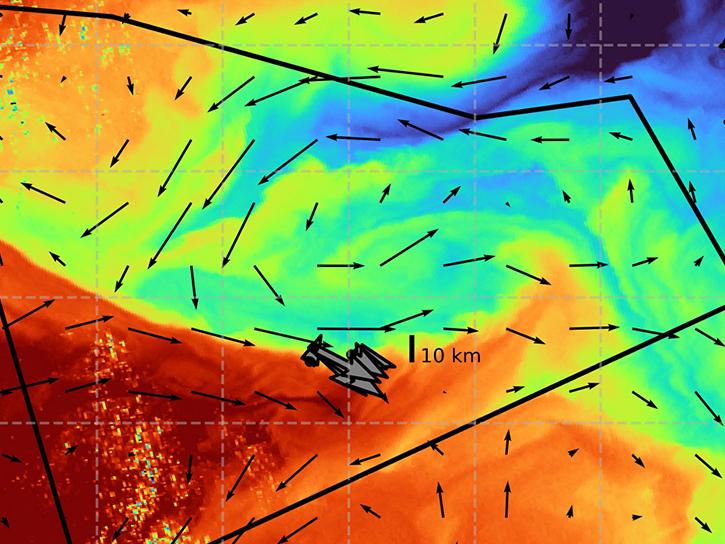
The S-MODE project combined airborne remote sensing and in-situ data to reveal upper-ocean dynamics and small-scale ocean features.
Join us to learn more about the Sub-Mesoscale Ocean Dynamics Experiment (S-MODE) and how to access and use its free and open data.
Frequently Asked Questions
Earthdata Forum
Our online forum provides a space for users to browse thousands of FAQs about research needs, data, and data applications. You can also submit new questions for our experts to answer.
Submit Questions to Earthdata Forumand View Expert Responses