We are in the process of migrating all NASA Earth science data sites into Earthdata from now until end of 2026. Not all NASA Earth science data and resources will appear here until then. Thank you for your patience as we make this transition.
Read about the Web Unification Project
Natural Hazards Data Access and Tools
From discovery to visualization, data tools such as the SEDAC Hazards Mapper and NASA's Flooding Days Projection Tool guide users in making the most of natural hazards data.
Natural Hazards Datasets
| Dataset Sort descending | Version | Platforms | Instruments | Temporal Extent | Spatial Extent | Spatial Resolution | Data Format |
|---|---|---|---|---|---|---|---|
| An integrated Wildfire Event Dataset (iWED), Version 1, Continental U.S., 1992-2021 | 1 | COMPUTERS | Computer | 1992-01-01 to 2021-12-31 |
N: 71.1503 S: 25 E: -67.6 W: -178.821 |
CSV | |
| Annual Burned Area from Landsat, Mawas, Central Kalimantan, Indonesia, 1997-2015 | 1 | LANDSAT | ETM+, TM, OLI | 1997-01-01 to 2015-12-31 |
N: -2.21458 S: -2.50241 E: 114.609 W: 114.39 |
Shapefile | |
| Annual Global High-Resolution Extreme Heat Estimates (GEHE), 1983-2016 | 1.00 | MODELS | Computer | 1983-01-01 to 2016-12-31 |
N: 90 S: -90 E: 180 W: -180 |
GeoTIFF | |
| Annual Summary of Artificial Light At Night from VIIRS/S-NPP at CONUS County and Census Tract V1 (ALAN_VIIRS_CONUS) at GES DISC | 1 | Suomi-NPP | VIIRS | 2012-01-01 to 2020-12-31 |
N: 49.99792 S: 20.00208 E: -60.00208 W: -129.9979 |
||
| Annual wildland fire emissions (WFEIS v0.5) for Conterminous US and Alaska, 2001-2013 | 1 | Terra | MODIS | 2001-01-01 to 2013-12-31 |
N: 71.41 S: 24.2 E: -65 W: -178.22 |
GeoTIFF | |
| Arctic Boreal Annual Burned Area, Circumpolar Boreal Forest and Tundra, V2, 2002-2022 | 2 | COMPUTERS, Terra | Computer, MODIS | 2002-01-01 to 2022-12-31 |
N: 83.626 S: 50 E: 177.16 W: -179.522 |
COG | |
| Burned and Unburned Field Site Data, Noatak, Seward, and North Slope, AK, 2016-2018 | 1 | FIELD SURVEYS | SOIL MOISTURE PROBE, THERMOMETERS | 2016-07-22 to 2018-08-27 |
N: 69.6632 S: 65.0181 E: -148.641 W: -164.929 |
multiple | |
| CARVE: Alaskan Fire Emissions Database (AKFED), 2001-2013 | 1 | FIELD INVESTIGATION, MODELS, SATELLITES | Computer, MODIS | 2001-01-01 to 2013-12-31 |
N: 71.499 S: 58 E: -141 W: -168.5 |
GeoTIFF | |
| China Dimensions Data Collection: China Maps Bibliographic Database | 1.00 | MODELS | Computer | 1765-01-01 to 1994-12-31 |
N: 54 S: 18 E: 135 W: 73 |
MDB | |
| Circumpolar Fire Polygons with NBR, dNBR, RdNBR Metrics and Ecoregions, 1986-2020 | 1 | COMPUTERS | Computer | 1986-01-01 to 2020-12-31 |
N: 84.0695 S: 33.6975 E: 179.99 W: -179.99 |
GeoPackage |
SHOWING 10 OF 132
Featured Observation Method: VIIRS
NASA's Visible Infrared Imaging Radiometer Suite (VIIRS) provides active data for fire management and wildfire alert systems.

Learn how to use NASA's Fire Information for Resource Management System (FIRMS) and its enhanced User Interface that provides additional services and analysis capabilities for wildfire management.
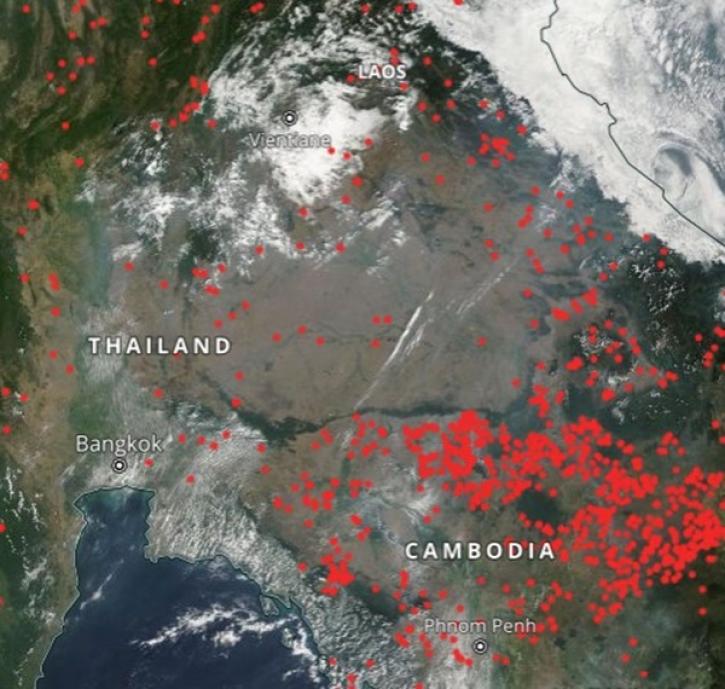
Geographer Veerachai Tanpipat promotes the use of NASA's Fire Information for Resource Management System (FIRMS) throughout the Lower Mekong River Region.
9 MIN READ

NASA’s worldwide Fire Information for Resource Management System (FIRMS) provides vital near real-time tools for managing wildland fires.
7 MIN READ
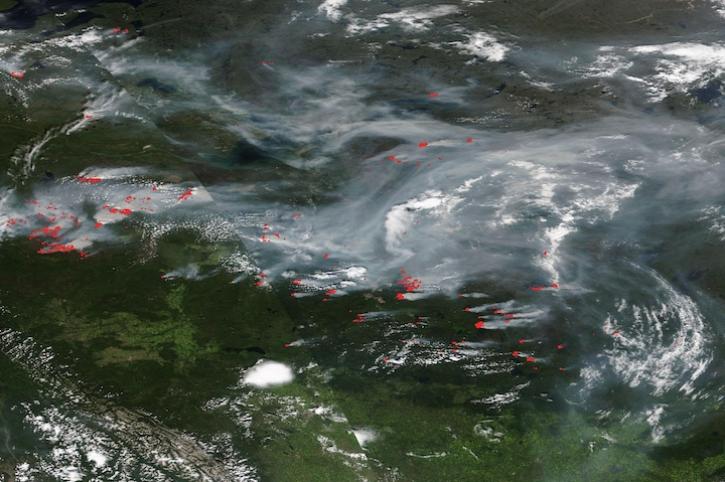
Image captured on July 17, 2024, by the VIIRS instrument aboard the joint NASA/NOAA NOAA-20 satellite.
Natural Hazards Data Tools
| Tool Sort descending | Description | Services | |
|---|---|---|---|
| Panoply | Panoply is a cross-platform application that plots geo-referenced and other arrays from netCDF, HDF, GRIB, and other datasets. | Visualization, Customization, Reformatting, Subsetting, Comparison | |
| SOTO | State of the Ocean (SOTO) is an interactive web-based tool that generates informative maps, animations, and plots that communicate and prove the discovery and analysis of the state of the oceans. | Analysis, Search and Discovery, Visualization | |
| TESViS | The Terrestrial Ecology Subsetting & Visualization Services Global Subsets Tool provides on-demand, customized subsets of several terrestrial ecology data products. | Visualization, Subsetting | |
| VEDA | NASA's Visualization, Exploration, and Data Analysis (VEDA) project is an open-source science cyberinfrastructure for data processing, visualization, exploration, and geographic information systems (GIS) capabilities. | Access, Analysis, Processing, Visualization, Geoprocessing | |
| Vertex | Vertex is a graphical search interface for finding synthetic aperture radar (SAR) data. | Search and Discovery, Access, Downloading, Processing, Subsetting |
SHOWING 5 OF 15
Frequently Asked Questions
Earthdata Forum
Our online forum provides a space for users to browse thousands of FAQs about research needs, data, and data applications. You can also submit new questions for our experts to answer.
Submit Questions to Earthdata Forumand View Expert Responses