We are in the process of migrating all NASA Earth science data sites into Earthdata from now until end of 2026. Not all NASA Earth science data and resources will appear here until then. Thank you for your patience as we make this transition.
Read about the Web Unification Project
Climate Indicators Learning Resources
Webinars, tutorials, data recipes and more to help you work with Climate Indicators.
Filters

This ARSET training provides an overview of atmospheric carbon dioxide measurements from space with the OCO-2 and OCO-3 satellite missions.
Training
May 24 - June 2, 2022
Esta capacitación de ARSET cubre mediciones de CO₂ atmosférico desde el espacio con las misiones OCO-2 y OCO-3.
Training
May 24 - June 2, 2022
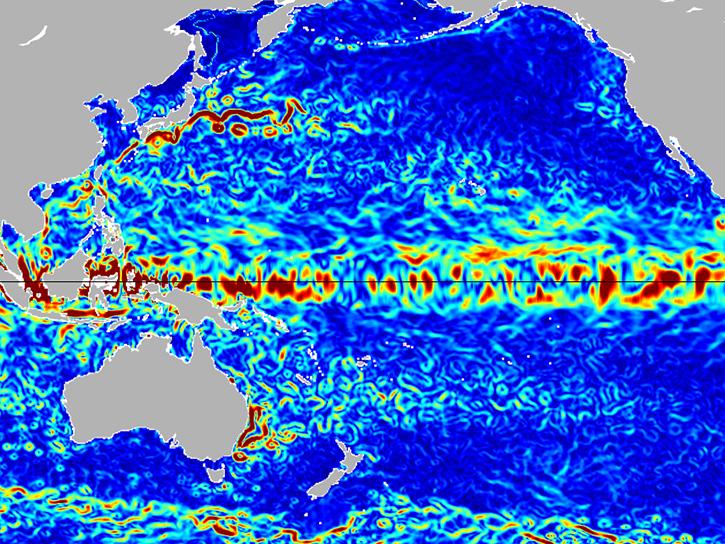
Join us to learn how to use NASA's Physical Oceanography Distributed Active Archive Center (PO.DAAC) State Of The Ocean (SOTO) toolkit to visualize and compare physical oceanography data!
Webinar
April 20, 2022
Join us to learn more about the migration of NASA PO.DAAC physical oceanography data to the Earthdata Cloud hosted in the Amazon Cloud (AWS). During this webinar, we will discuss which data will be hosted in the cloud, show you options for how to migrate your ocean data discovery and access process to the cloud, and also provide useful resources to support you in navigating this migration.
Webinar
April 15, 2022

Esta capacitación de ARSET cubre técnicas avanzadas de radar usando polarimetría para extraer información de cultivos.
Training
April 12 - May 3, 2022
This ARSET training presents more advanced radar remote sensing techniques using polarimetry to extract crop structural information.
Training
April 12 - May 3, 2022
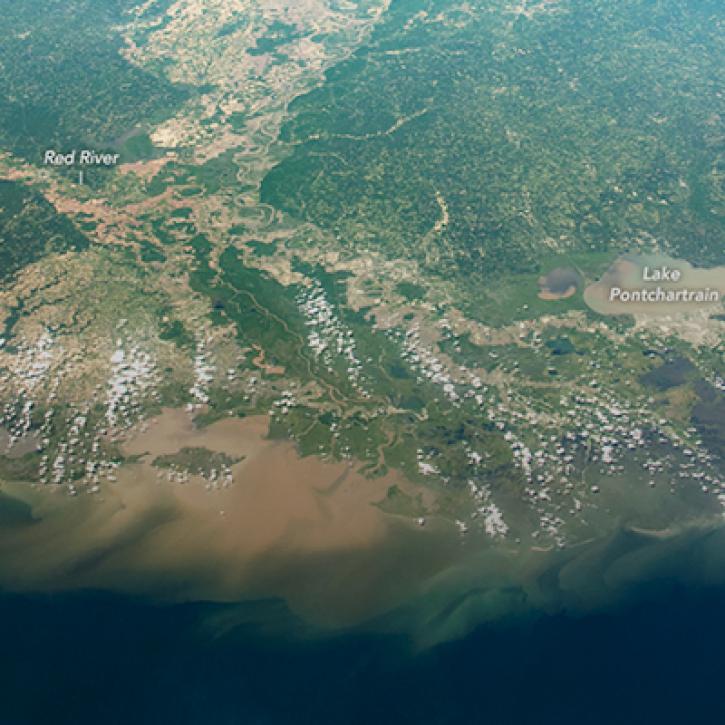
NASA Models Reveal Climate-Induced and Management Impacts on the Mississippi River Delta
StoryMap
Feb. 1, 2022

Researchers used satellite and saildrone data to measure sea surface salinity in coastal waters freshened by river runoff in the Yukon Delta.
Data in Action
Oct. 5, 2021
SHOWING 8 OF 76
Frequently Asked Questions
Earthdata Forum
Our online forum provides a space for users to browse thousands of FAQs about research needs, data, and data applications. You can also submit new questions for our experts to answer.
Submit Questions to Earthdata Forumand View Expert Responses