We are in the process of migrating all NASA Earth science data sites into Earthdata from now until end of 2026. Not all NASA Earth science data and resources will appear here until then. Thank you for your patience as we make this transition.
Read about the Web Unification Project
Climate Indicators Learning Resources
Webinars, tutorials, data recipes and more to help you work with Climate Indicators.
Filters

This ARSET training provides lectures and case studies focused on the use of Earth observations for operational fire monitoring.
Training
May 11-27, 2021
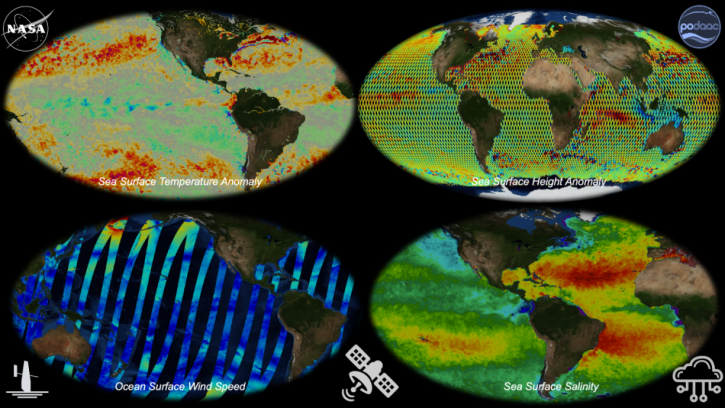
Join us to learn about NASA's archive for physical oceanography data in the context of Open Science. We'll provide you with an introduction to remote sensing and in situ products at PO.DAAC and show you how to work with these data in the cloud.
Webinar
April 22, 2021

Satellite data reveals the oceanic response to the record-setting season.
Data in Action
March 25, 2021

Charting global mean sea level rise since 1900.
Data in Action
Nov. 19, 2020

This ARSET training teaches how to use earth observations to estimate water budgets for a given river basin.
Training
July 21 - Aug. 4, 2020

This ARSET training focuses on the use of remote sensing to understand global phenology.
Training
June 30 - July 14, 2020

This ARSET training addresses how to use remote sensing data for agriculture monitoring, specifically drought and crop monitoring.
Training
April 14 - May 5, 2020

Evaluating the evolution of ocean response to the 2019 Atlantic tropical cyclones.
Data in Action
April 2, 2020
SHOWING 8 OF 76
Frequently Asked Questions
Earthdata Forum
Our online forum provides a space for users to browse thousands of FAQs about research needs, data, and data applications. You can also submit new questions for our experts to answer.
Submit Questions to Earthdata Forumand View Expert Responses