
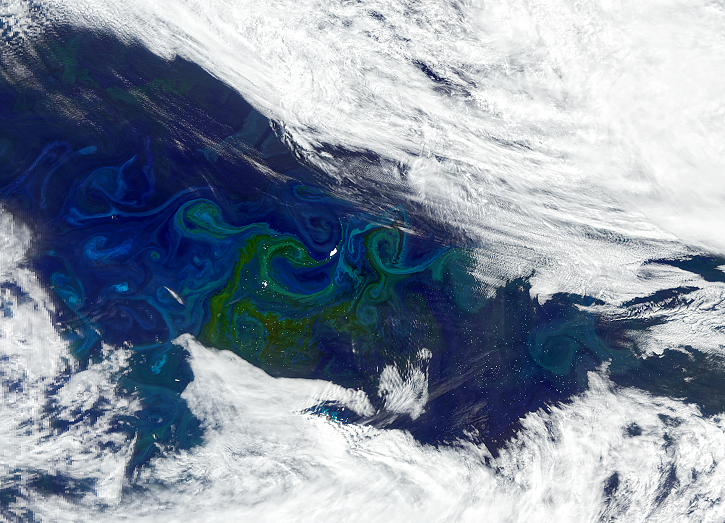
Plankton is a general term for marine or aquatic organisms that can only swim very weakly, if at all. In addition to creatures like jellyfish, plankton includes hundreds of species of tiny, sometimes microscopic, organisms that can be classified into zooplankton (which eat other plankton) and phytoplankton (which photosynthesize like plants). Phytoplankton form the center of marine food webs, making their population changes critical to entire marine ecosystems.

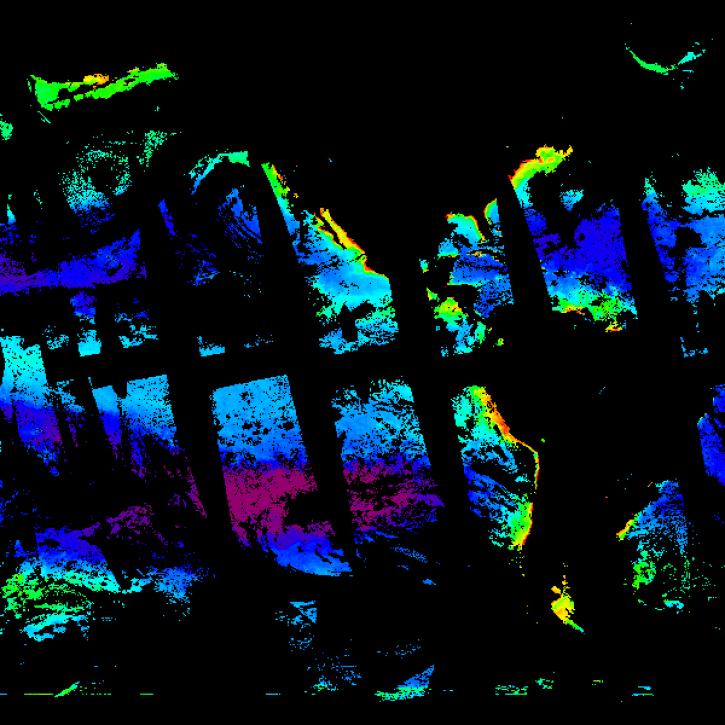
Understanding phytoplankton distribution, climate impacts, and population dynamics is essential for marine biology, oceanography, and fisheries management. These can be studied from orbit with detailed observations of ocean color. NASA's 2025 PACE mission studies phytoplankton from space using daily data from its Ocean Color Instrument (OCI), which detects more 100 light wavelengths across the visual, infrared, and ultraviolet spectra. Researchers can use machine learning to match these wavelengths to spectral libraries, identifying specific phytoplankton species by their unique light absorption patterns.

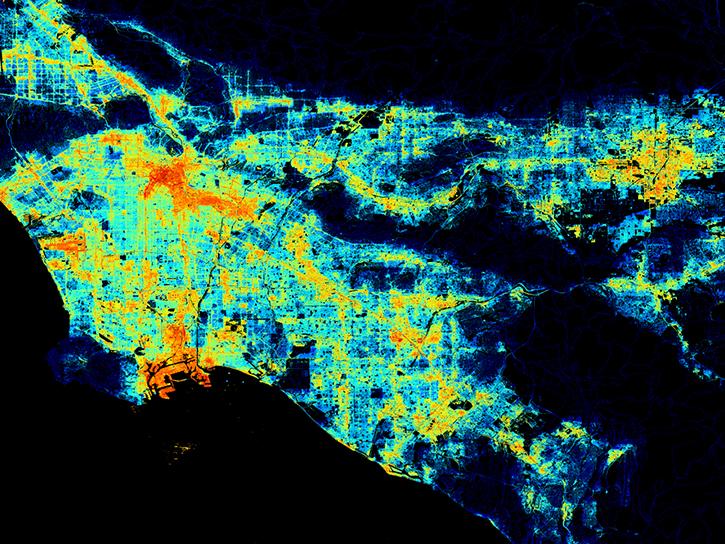
While PACE provides unprecedented detail on phytoplankton communities, NASA's MODIS instruments have mapped global marine chlorophyll — the main pigment used for photosynthesis, and a useful proxy for phytoplankton activity — since 2002 using blue-green ocean ratios. MODIS offers broader productivity estimates and valuable long-term data to detect trends, complementing PACE's detailed species breakdown. 

The Visible Infrared Imaging Radiometer Suite (VIIRS) also collects detailed visible and infrared imagery of the world's ocean and land surfaces. VIIRS was designed for compatibility with existing data records from MODIS, ensuring the continuity of this long-running observational record after MODIS is retired in 2026 or 2027.

These phytoplankton studies reveal marine ecosystem dynamics and climate impacts. NASA supports accessibility through tutorials, data recipes, and webinars alongside datasets from PACE, MODIS, VIIRS, and other missions.

Get Phytoplankton Data

Access a range of datasets and data tools to further your phytoplankton research. 

Learn How to Use Phytoplankton Data

Access a range of webinars, tutorials, data recipes, and data stories to enhance your knowledge of Earth Observation data.
Black Marble HD 2016 annual composite over Los Angeles, CA generated using the NASA VIIRS DNB algorithm. Click on image to see larger version.
An Introduction to Suomi NPP NASA VIIRS Data Products
Learn how to access and use VIIRS/Suomi-NPP data products.
This is an image showing simulated chlorophyll concentrations in the ocean on March 21, 2022. The image has a black background. Regions colored in blue represent areas of low chlorophyll concentration, green are medium, and red areas have high levels. The image has strips of black running through the colored areas from the upper left to the lower right to show PACE’s orbital track around the globe and places across the ocean where it has not scanned.
Preparing for PACE Data
Simulated data help Plankton, Aerosol, Cloud, ocean Ecosystem (PACE) users prepare a day in the life of the new satellite.
This square image shows phytoplankton levels along Florida and the East Coast of the United States as well as the Bahamas. Land is colored in muted shades of brown and green, water is dark blue, and snow is white. Nearshore are bands of light to dark green depicting picoeukaryote organism levels. Further out to sea are regions in variations of light blue showing the presences of prochlorococcus cyanobacteria.
New PACE Data Tutorials
A series of Jupyter notebook tutorials show how to retrieve and use data from NASA's Plankton, Aerosol, Cloud, ocean Ecosystem (PACE) mission.
Icebergs circulate in the South Atlantic Ocean currents near the island of South Georgia. Around them, phytoplankton is blooming, creating large green-tinted swirls in this NASA Plankton, Aerosol, Cloud, ocean Ecosystem (PACE) Ocean Color Instrument (OCI) acquired on January 5, 2025.
Discover the Help Hub for Ocean Color Learning Resources
The Help Hub hosted by NASA's Ocean Biology Distributed Active Archive Center (OB.DAAC) has been updated with new learning resources for processing ocean color satellite data, working with Plankton, Aerosol, Cloud, ocean Ecosystem (PACE) data, and more.
Discover and Visualize Phytoplankton Data
NASA data help us understand Earth's changing systems in more detail than ever before, and visualizations help make science concepts accessible, beautiful, and impactful.
Data visualization is a powerful tool for analysis, trend and pattern recognition, and communication. Our resources help you find data visualizations to complement and enhance your research. We also have tools and tutorials to help you translate phytoplankton data into compelling visuals.
Image
Phytoplankton bloom in Long Bay, Australia on 12 January 2024 from the VIIRS instrument aboard the joint NASA/NOAA Suomi NPP satellite
The VIIRS instrument aboard the joint NASA/NOAA Suomi NPP satellite acquired this image of Long Bay, Australia, on January 12, 2024. The chlorophyll-a data layer over the ocean indicates the presence of a phytoplankton bloom.

Join Our Community of NASA Data Users

While NASA data are openly available without restriction, an Earthdata Login is required to download data and to use some tools with full functionality.

Learn About the Benefits of Earthdata Login

Frequently Asked Questions

Earthdata Forum

Our online forum provides a space for users to browse thousands of FAQs about research needs, data, and data applications. You can also submit new questions for our experts to answer.

Submit Questions to Earthdata Forumand View Expert Responses

Earthdata
Forum