We are in the process of migrating all NASA Earth science data sites into Earthdata from now until end of 2026. Not all NASA Earth science data and resources will appear here until then. Thank you for your patience as we make this transition.
Read about the Web Unification Project
Humidity Data Access and Tools
NASA’s humidity data range from hourly primary forcing data to modeled data based on measurements from high-altitude aircraft. Our datasets and tools help users find and integrate the data they need to see how humidity influences weather, ecosystems, and how we live our lives.
Humidity Datasets
| Dataset Sort descending | Version | Platform | Instrument | Temporal Extent | Spatial Extent | Spatial Resolution | Data Format |
|---|---|---|---|---|---|---|---|
| OWLETS-2 Surface (Ground) Data | 1 | GROUND STATIONS, Vaisala HydroMet AWS | GAS SENSORS, LGR CRDS, Picarro G2401, TEMPERATURE SENSORS, PRESSURE SENSORS, HUMIDITY SENSORS | 2018-05-23 to 2018-08-02 | ICARTT | ||
| OWLETS-2 University of Maryland Cessna Aircraft Data | 1 | UMD Cessna, HU-25A | GPS, GAS SENSORS, TSI-3563 Neph, AETHALOMETER, PSAP, Picarro G2401, LGR CRDS, GeoTASO | 2017-07-07 to 2018-07-20 | ICARTT, HDF5 | ||
| P-3 Meteorological and Navigation Data IMPACTS | 1 | NASA P-3 | GPS, HYGROMETERS, KT19 Pyrometer, RADAR ALTIMETERS, TEMPERATURE PROBES, TEMPERATURE SENSORS | 2020-01-12 to 2023-02-28 |
N: 48.237 S: 33.261 E: -64.987 W: -95.243 |
ASCII | |
| PISTON 2018 Research Vessel (RV) Mirai Ship Data | 1 | R/V Mirai | RADAR, RAWINSONDES | 2018-08-13 to 2018-09-02 | ASCII, TAR | ||
| PISTON 2018 Research Vessel (RV) Thompson ship datasets of ocean, atmosphere, and air-sea interaction | 1 | R/V Thompson | SEA-POL, CTD, ADCP, CHAM, SO, ROSR, W-Band Radar, CEILOMETERS, RADIOMETERS, RAWINSONDES, DISDROMETERS, GPS, Hemisphere VS1000, Gill WindMaster Pro, Vaisala HMT330, ORG-815-DA, Vaisala PTB330, NOAA PSL Sea Snake, SBE-21, Riegl LD90-3100VHS-FLP, Eppley PIR, Vaisala HMT337 | 2018-08-18 to 2018-10-13 | netCDF-4, Text File, TAR | ||
| PISTON 2018-2019 Island Rawinsonde Data | 1 | GROUND STATIONS | RAWINSONDES | 2018-08-13 to 2019-10-13 | ASCII | ||
| PISTON 2019 Research Vessel (RV) Sally Ride Data | 1 | R/V Sally Ride | CTD, ADCP, SEA-POL, CHAM, SO, ROSR, HSRL, W-Band Radar, CEILOMETERS, RAWINSONDES, DISDROMETERS, LIDAR, GPS, Hemisphere VS1000, Gill WindMaster Pro, Vaisala HMT337, Vaisala HMT330, ORG-815-DA, Vaisala PTB330, NOAA PSL Sea Snake, SBE-21, Riegl LD90-3100VHS-FLP, Eppley PIR | 2019-08-31 to 2019-09-26 | NetCDF-4, TAR, Text File | ||
| POLARIS Balloonsondes and Ozonesondes Data | 1 | BALLOONS | OZONESONDES | 1996-10-29 to 1997-10-29 | AMES | ||
| Puerto Rico Radiosondes CPEX-AW V1 | 1 | GROUND STATIONS | RADIOSONDES | 2021-08-24 to 2021-09-28 |
N: 18.4477 S: 17.8794 E: -67.0027 W: -67.6051 |
CSV | |
| QuikSCAT ESDR Level 2 Ancillary Ocean Surface Fields Version 1.1 | 1.1 | MODELS, QUIKSCAT | Computer, SEAWINDS | 2000-06-01 to 2009-11-22 |
N: 90 S: -90 E: 180 W: -180 |
12.5 Kilometers x 12.5 Kilometers | netCDF-4 |
| Radiosondes CPEX-CV | 1 | GROUND STATIONS | RADIOSONDES | 2022-09-01 to 2022-09-29 |
N: 16.789384 S: 0.053658 E: -0.073876 W: -23.400798 |
netCDF-4 | |
| RI CPEX | 1 | GCOM-W1, GPM, DMSP 5D-3/F16, DMSP 5D-3/F18 | AMSR2, GMI, SSMIS | 2017-05-24 to 2017-07-16 |
N: 47.73 S: -2.1 E: -25.2 W: -120.17 |
||
| RM-OBS/PU Potential Evapotranspiration and Supporting Forcing L4 3-hourly 0.25x0.25 degree V001 (PET_PU_3H025) at GES DISC | 001 | RM-OBS/PU | NOT APPLICABLE | 1984-01-01 to 2006-12-31 |
N: 90 S: -60 E: 180 W: -180 |
0.25 Decimal Degrees x 0.25 Decimal Degrees | |
| RM-OBS/PU Potential Evapotranspiration and Supporting Forcing L4 3-hourly 0.25x0.25 degree V002 (PET_PU_3H025) at GES DISC | 002 | RM-OBS/PU | NOT APPLICABLE | 1984-01-01 to 2016-12-31 |
N: 90 S: -60 E: 180 W: -180 |
0.25 Decimal Degrees x 0.25 Decimal Degrees | |
| SAFARI 2000 ETA Atmospheric Model Data, Wet and Dry Seasons 2000 | 1 | NOT APPLICABLE | NOT APPLICABLE | 2000-02-01 to 2000-09-30 |
N: -9 S: -53 E: 53 W: -13 |
Shapefile | |
| SAFARI 2000 JRA Aerocommander Trace Gas, Aerosol, and CCN Data, Dry Season 2000 | 1 | AC-680E | IR CO2 ANALYZER, HUMIDITY SENSORS, THERMOCOUPLES, PRESSURE SENSORS, CNC, UV OZONE DETECTORS, CHEMILUMINESCENCE, FLUORESCENCE SPECTROSCOPY | 2000-08-15 to 2000-09-07 |
N: -17.8293 S: -30.1916 E: 33.1635 W: 22.156 |
ASCII | |
| SAFARI 2000 JRB Aerocommander Trace Gas and Aerosol Data, Dry Season 2000 | 1 | AC-680E | IR CO2 ANALYZER, HUMIDITY SENSORS, THERMOCOUPLES, PRESSURE SENSORS, CNC, UV OZONE DETECTORS, CHEMILUMINESCENCE, FLUORESCENCE SPECTROSCOPY | 2000-08-15 to 2000-09-07 |
N: -17.8293 S: -30.1916 E: 33.1635 W: 22.156 |
ASCII | |
| SAFARI 2000 Kalahari Transect CO2, Water Vapor, and Heat Flux, Wet Season 2000 | 1 | FIELD INVESTIGATION, FIXED OBSERVATION STATIONS | TDR, THERMOCOUPLES, SOIL HEAT FLUX TRANSDUCER, INFRARED THERMOMETERS, TEMPERATURE SENSORS, SONIC ANEMOMETER, IR CO2 ANALYZER, NET RADIOMETERS, HUMIDITY SENSORS | 2000-03-01 to 2000-03-19 |
N: -15.438 S: -24.164 E: 23.594 W: 21.713 |
Shapefile | |
| SAFARI 2000 Meteorological and Flux Tower Measurements in Maun, Botswana, 2000 | 1 | FIXED OBSERVATION STATIONS, FIELD INVESTIGATION | PYRANOMETERS, IRGA, PRESSURE TRANSDUCERS, TEMPERATURE PROBES, RTD, ANEMOMETERS, LICOR QUANTUM SENSOR, RAIN GAUGES, HUMIDITY SENSORS, SOIL MOISTURE PROBE, THERMOMETERS | 2000-02-01 to 2000-09-30 |
N: -19.9 S: -19.9 E: 23.55 W: 23.55 |
Shapefile | |
| SAFARI 2000 Meteorological Tower Measurements, Kruger National Park, 2000-2002 | 1 | FIXED OBSERVATION STATIONS | PYRANOMETERS, HUMIDITY SENSORS, RAIN GAUGES, WIND VANES, ANEMOMETERS, LICOR GAS EXCHANGE SYSTEM, TEMPERATURE PROBES | 2000-02-15 to 2002-12-31 |
N: -25.0197 S: -25.0197 E: 31.4969 W: 31.4969 |
Shapefile | |
| SAFARI 2000 MODIS Water and Heat Fluxes, Maun, Botswana, Dry Season 2001 | 1 | FIXED OBSERVATION STATIONS, FIELD INVESTIGATION, Terra, MODELS | PRESSURE SENSORS, WIND MONITOR, HUMIDITY SENSORS, NET RADIOMETERS, EDDY CORRELATION DEVICES, SOIL HEAT FLUX TRANSDUCER, MODIS, Computer | 2001-09-02 to 2001-09-29 |
N: -17.9946 S: -21.0004 E: 24.5004 W: 21.4946 |
Shapefile | |
| SAFARI 2000 SHADOZ Ozonesonde Data, Zambia and Regional Sites, Dry Season 2000 | 1 | BALLOONS | OZONESONDES, HUMIDITY SENSORS, RADIOSONDES | 2000-08-01 to 2000-11-30 |
N: -7.98 S: -7.98 E: 55.48 W: 55.48 |
Shapefile | |
| SAFARI 2000 Surface Atmospheric Radiative Transfer (SMART), Dry Season 2000 | 1 | GROUND STATIONS | TEMPERATURE SENSORS, BAROMETERS, Pyrgeometer, PYRHELIOMETERS, PYRANOMETERS, HUMIDITY SENSORS | 2000-08-15 to 2000-09-17 |
N: -24.969 S: -24.969 E: 31.593 W: 31.593 |
Shapefile | |
| SAFARI 2000 Upper Air Meteorological Profiles, Skukuza, Dry Seasons 1999-2000 | 1 | BALLOONS | RADIOSONDES | 1999-08-14 to 2000-09-23 |
N: -24.969 S: -24.969 E: 31.593 W: 31.593 |
Shapefile | |
| SAFARI 2000 Upper Air Meteorological Profiles, South Africa, Dry Season 2000 | 1 | BALLOONS | RADIOSONDES | 2000-08-01 to 2000-09-30 |
N: -24 S: -41 E: 31 W: -10 |
Shapefile |
Featured Humidity Observation Method: MLS
The Microwave Limb Sounder (MLS) instrument is carried aboard the Aqua satellite and acquires measurements globally day and night. The MLS makes measurements of atmospheric composition, temperature, humidity and cloud ice that are needed to learn more about weather, climate, and air quality.

The Microwave Limb Sounder Near-Real Time (MLS NRT) products are provided by the Land, Atmosphere Near-real time Capability for EOS (LANCE).
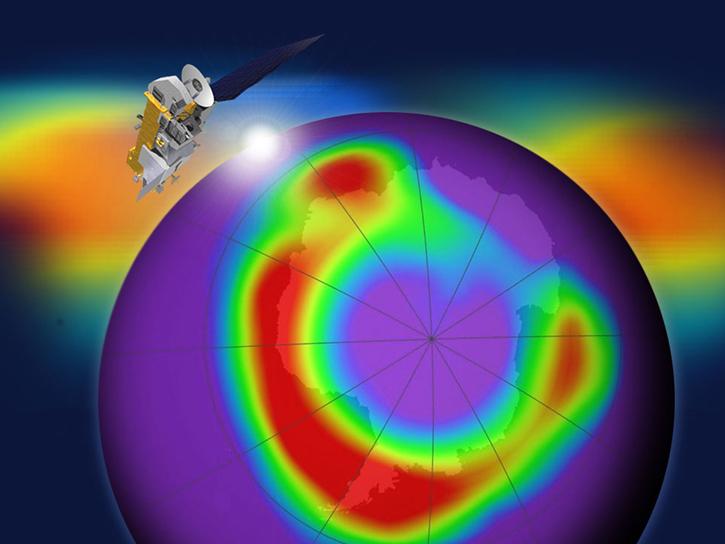
In coordination with the Microwave Limb Sounder (MLS) team, we now have several MLS products available through the GIBS image access APIs.

Learn how to visualize Microwave Limb Sounder data through OPeNDAP.
Frequently Asked Questions
Earthdata Forum
Our online forum provides a space for users to browse thousands of FAQs about research needs, data, and data applications. You can also submit new questions for our experts to answer.
Submit Questions to Earthdata Forumand View Expert Responses