We are in the process of migrating all NASA Earth science data sites into Earthdata from now until end of 2026. Not all NASA Earth science data and resources will appear here until then. Thank you for your patience as we make this transition.
Read about the Web Unification Project
Air Quality Data Access and Tools
NASA has air quality datasets that help researchers characterize the particular makeup of the air we breathe. Access a range of data and data tools such as AppEEARS, FIRMS, and Giovanni to make the most of air quality data.
Air quality comprises a constellation of scientific topics that inform our understanding of this field. Learn more about data and resources focused on aerosol optical depth, aerosol index, trace gases, land surface reflectance, the effect of dust, ash, and smoke, and human dimensions, including natural hazards.
Many NASA observation methods—platforms, instruments, and space geodesy techniques—provide data that improve our understanding of air quality, including NASA's Tropospheric Emissions: Monitoring Pollution (TEMPO) instrument, featured below. Learn more about how the Advanced Spaceborne Thermal Emission and Reflection Radiometer (ASTER), Harmonized Landsat Sentinel-2 (HLS), Moderate Resolution Imaging Spectroradiometer (MODIS), and Visible Infrared Imaging Radiometer Suite (VIIRS) continually acquire data about pollutants.
Air Quality Datasets
| Dataset Sort descending | Version | Platform | Instrument | Temporal Extent | Spatial Extent | Spatial Resolution | Data Format |
|---|---|---|---|---|---|---|---|
| BOREAS TF-02 SSA-OA Tethersonde Meteorological and Ozone Data | 1 | BALLOONS | ANEROID PRESSURE SENSOR, THERMISTORS, ANEMOMETERS, OZONESONDES | 1993-10-17 to 1994-09-19 |
N: 53.63 S: 53.63 E: -106.2 W: -106.2 |
ASCII | |
| BOREAS TGB-10 Oxidant Flux Data over the SSA | 1 | FIELD INVESTIGATION | HPLC | 1994-05-25 to 1994-09-09 |
N: 53.99 S: 53.99 E: -105.12 W: -105.12 |
ASCII | |
| BOREAS TGB-10 Volatile Organic Carbon Data over the SSA | 1 | FIELD INVESTIGATION | GAS CHROMATOGRAPHS | 1994-05-31 to 1994-09-09 |
N: 53.99 S: 53.63 E: -104.69 W: -106.2 |
ASCII | |
| BOREAS/AES MARS-II 15-minute Surface Meteorological Data: 1994 | 1 | METEOROLOGICAL STATIONS | CEILOMETERS, RAIN GAUGES, TEMPERATURE SENSORS, Visibility Sensor, WIND MONITOR, ANEROID PRESSURE SENSOR | 1994-05-24 to 1994-09-20 |
N: 59.56 S: 51.08 E: -97.55 W: -108.43 |
ASCII | |
| BOREAS/AES READAC 15-minute Surface Meteorological Data | 1 | METEOROLOGICAL STATIONS | PRESSURE TRANSDUCERS, THERMISTORS, TEMPERATURE PROBES, Visibility Sensor, RAIN GAUGES, WIND MONITOR, CEILOMETERS | 1994-05-24 to 1994-09-20 |
N: 52.7 S: 52.7 E: -102.32 W: -102.32 |
ASCII | |
| CAMP2Ex Merge Data Files | 1 | NASA P-3 | Computer | 2019-08-22 to 2019-10-07 | ICARTT, ZIP | ||
| CAMP2Ex P-3 In-Situ Trace Gas Data | 1 | NASA P-3 | GAS SENSORS, CRDS | 2019-08-03 to 2019-10-06 | ICARTT | ||
| CARVE: Alaskan Fire Emissions Database (AKFED), 2001-2013 | 1 | FIELD INVESTIGATION, MODELS, SATELLITES | Computer, MODIS | 2001-01-01 to 2013-12-31 |
N: 71.499 S: 58 E: -141 W: -168.5 |
GeoTIFF | |
| CMS: Atmospheric CO2 and C Isotopes, Fossil Fuel Contributions, California, 2014-2015 | 1 | METEOROLOGICAL STATIONS, MODELS | PICARRO G2401-mc CO2, CH4, CO, H2O INSTRUMENT, Computer | 2014-05-01 to 2015-02-16 |
N: 41.055 S: 32.867 E: -117.257 W: -124.151 |
CSV | |
| CMS: Carbon Fluxes from Global Agricultural Production and Consumption, 2005-2011 | 1 | MODELS | Computer | 2005-01-01 to 2011-12-31 |
N: 83.637 S: -59.463 E: 180 W: -180 |
netCDF-4 | |
| CMS: CO2 Signals Estimated for Fossil Fuel Emissions and Biosphere Flux, California | 1 | COMPUTERS, OCO-2 | FLASKS, OCO SPECTROMETERS | 2010-11-01 to 2011-05-31 |
N: 42.82 S: 32.2044 E: -115.963 W: -124.51 |
CSV | |
| CMS: Global 0.5-deg Wetland Methane Emissions and Uncertainty (WetCHARTs v1.0) | 1 | MODELS | Computer | 2001-01-01 to 2015-12-31 |
N: 90 S: -90 E: 180 W: -180 |
multiple | |
| CMS: Global 0.5-deg Wetland Methane Emissions and Uncertainty (WetCHARTs v1.3.3) | 1.3.3 | COMPUTERS | Computer | 2001-01-01 to 2022-08-31 |
N: 90 S: -90 E: 180 W: -180 |
netCDF-3 | |
| CMS: Global Carbon Fluxes Associated with Livestock Feed and Emissions, 2000-2013 | 2 | Models | Computer | 2000-01-01 to 2013-12-31 |
N: 90 S: -90 E: 180 W: -180 |
multiple | |
| CMS GOSAT and ObsPack L4 Top-down yearly methane emissions for individual sectors at 0.5x0.625 degrees for North America V1 (CMS_GO_CH4_SEC_TDYC_NA) | 1 | GOSAT | TANSO-FTS | 2010-01-01 to 2017-12-31 |
N: 65 S: 15 E: -55 W: -130 |
0.625 Decimal Degrees x 0.5 Decimal Degrees | |
| CO2 Observations, Modeled Emissions, and NAM-HYSPLIT Footprints, Boston MA, 2013-2014 | 1 | METEOROLOGICAL STATIONS | SPECTROMETERS | 2013-09-01 to 2014-12-31 |
N: 43.709 S: 41.35 E: -70 W: -72.18 |
multiple | |
| COMEX: AMOG Surface Mobile in situ Data Surveyor, USA, 2014-2015 | 1 | FIELD SURVEYS | VCEIL, TEMPERATURE SENSORS, PRESSURE SENSORS, CO2 ANALYZERS, UV OZONE DETECTORS, GAS SENSORS, OPTSPEC | 2014-06-07 to 2015-08-20 |
N: 36.2115 S: 32.9689 E: -115.564 W: -120.716 |
HDF5 | |
| Country Trends in Major Air Pollutants | 1.00 | MODELS | Computer | 2003-01-01 to 2018-12-31 |
N: 90 S: -90 E: 180 W: -180 |
Excel, PDF, PNG | |
| Country-Level GDP and Downscaled Projections Based on the SRES A1, A2, B1, and B2 Marker Scenarios, 1990-2100 | 1.0 | MODELS | Computer | 1990-01-01 to 2100-12-31 |
N: 90 S: -90 E: 180 W: -180 |
Excel | |
| Country-Level Population and Downscaled Projections Based on the SRES A1, B1, and A2 Scenarios, 1990-2100 | 1.0 | MODELS | Computer | 1990-01-01 to 2100-12-31 |
N: 90 S: -90 E: 180 W: -180 |
Excel | |
| Country-Level Population and Downscaled Projections Based on the SRES B2 Scenario, 1990-2100 | 1.0 | MODELS | Computer | 1990-01-01 to 2100-12-31 |
N: 90 S: -90 E: 180 W: -180 |
Excel | |
| Daily and Annual PM2.5 Concentrations for the Contiguous United States, 1-km Grids, v1 (2000 - 2016) | 1.0 | MODELS | Computer | 2000-01-01 to 2016-12-31 |
N: 72 S: 17 E: -65 W: -180 |
0.00833 Decimal Degrees x 0.00833 Decimal Degrees | GeoTIFF, Shapefile |
| Daily and Annual PM2.5 Concentrations for the Contiguous United States, 1-km Grids, Version 1.10 (2000-2016) | 1.10 | MODELS | Computer | 2000-01-01 to 2016-12-31 |
N: 72 S: 17 E: -65 W: -180 |
0.00833 Decimal Degrees x 0.00833 Decimal Degrees | GeoTIFF, Shapefile |
| Daily and Annual PM2.5, O3, and NO2 Concentrations at ZIP Codes for the Contiguous U.S., 2000-2016, v1.0 | 1.00 | MODELS | Computer | 2000-01-01 to 2016-12-31 |
N: 72 S: 17 E: -65 W: -180 |
CSV, RData | |
| DC3 In-Situ DC-8 Aircraft Trace Gas Data | 1 | NASA DC-8 | GC-MS, TD-LIF, DACOM, LWCC, CIT-ToF-CIMS, CHEMILUMINESCENCE, PTR-MS, DFGAS, AVOCET | 2012-05-04 to 2012-06-23 | ICARTT |
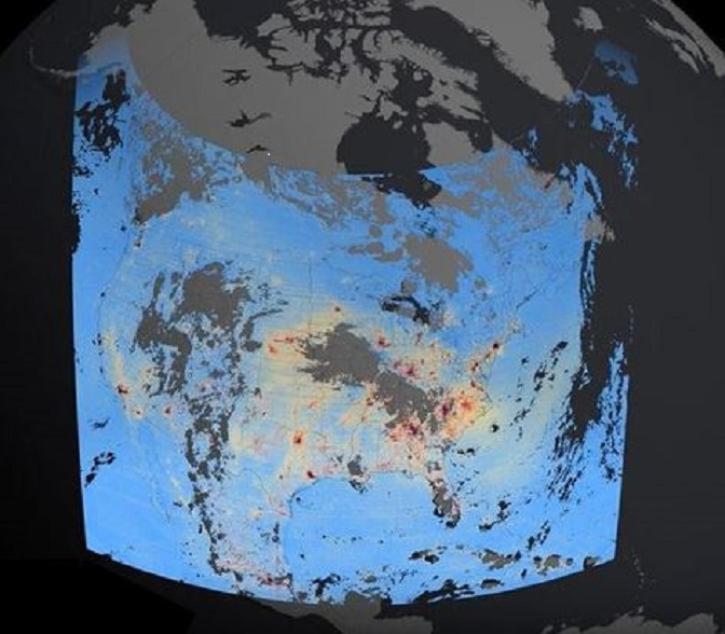
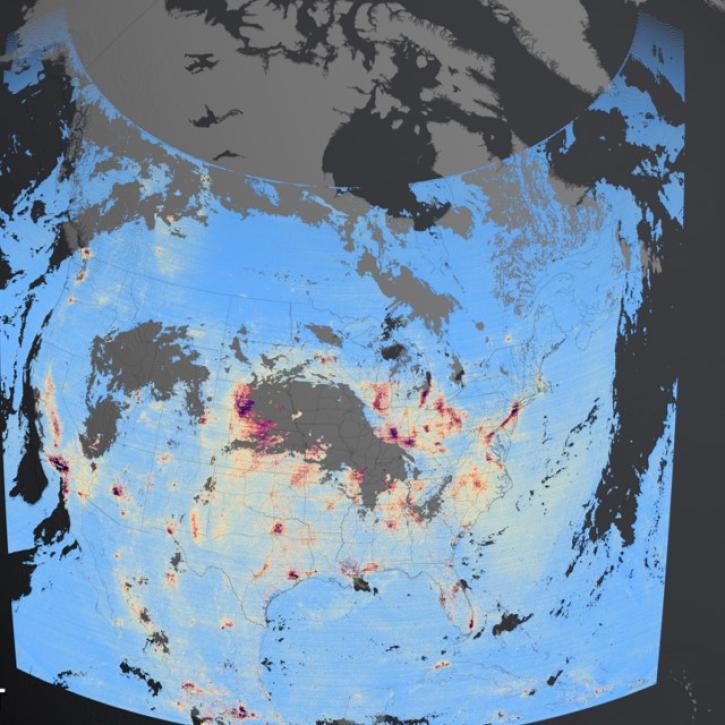
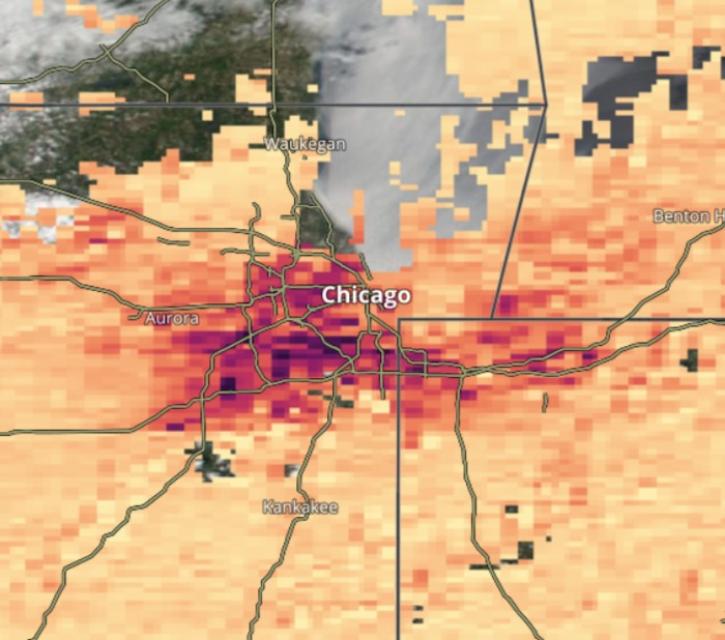
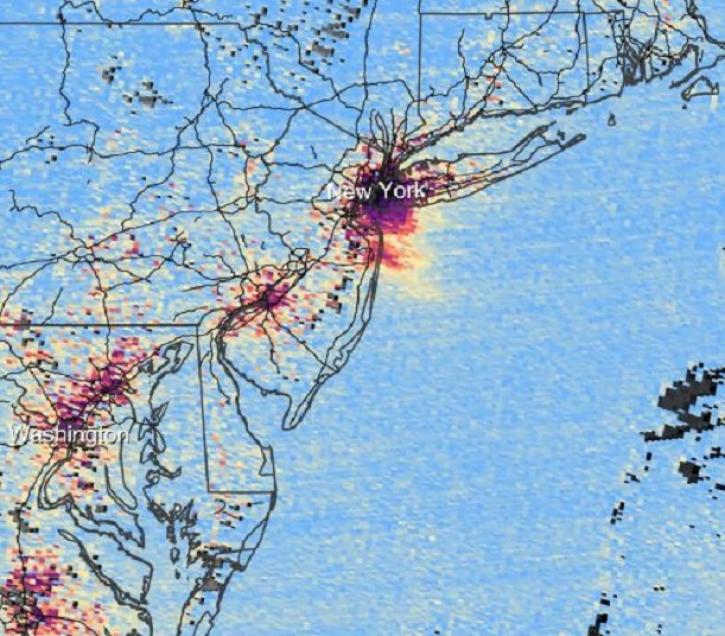
Featured Air Quality Observation Method: TEMPO
NASA's Tropospheric Emissions: Monitoring Pollution (TEMPO) instrument provides hourly measurements of O3, NO2, and other key elements of air pollution.
These new Tropospheric Emissions: Monitoring of Pollution (TEMPO) products will aid validation efforts and algorithm development, and will be used to expand the mission’s higher-level products.
5 MIN READ
This webinar provides an overview of the TEMPO mission and its data products and shows how to discover and access TEMPO data products using NASA's Earthdata Search.
The 14 layers from the Tropospheric Emissions: Monitoring of Pollution mission offer data on clouds, nitrogen dioxide, ozone, and more.
The beta release of Tropospheric Emissions: Monitoring of Pollution (TEMPO) mission data products lets users begin developing applications using these data.
Frequently Asked Questions
Earthdata Forum
Our online forum provides a space for users to browse thousands of FAQs about research needs, data, and data applications. You can also submit new questions for our experts to answer.
Submit Questions to Earthdata Forumand View Expert Responses