We are in the process of migrating all NASA Earth science data sites into Earthdata from now until end of 2026. Not all NASA Earth science data and resources will appear here until then. Thank you for your patience as we make this transition.
Read about the Web Unification Project
SRTM Resources
Earthdata resources for users working with NASA’s Shuttle Radar Topography Mission (SRTM) data include tutorials and other learning resources, news announcements such as instrument updates and data releases, user guides and related documents, and frequently asked questions.
SRTM Learning Resources
This ARSET training introduces the Variable Infiltration Capacity Model, sources of satellite-derived input data, and implementation of the model.
Training
Feb. 15 - March 1, 2018
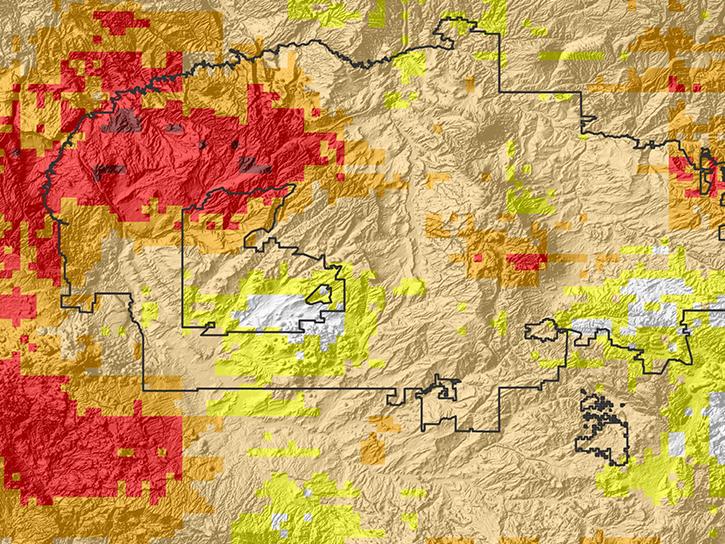
In Spring 2017, DEVELOP researchers in Phoenix used NASA data to determine how hot area bus stops are in summer to determine which ones need shelters.
Data in Action
Dec. 27, 2017
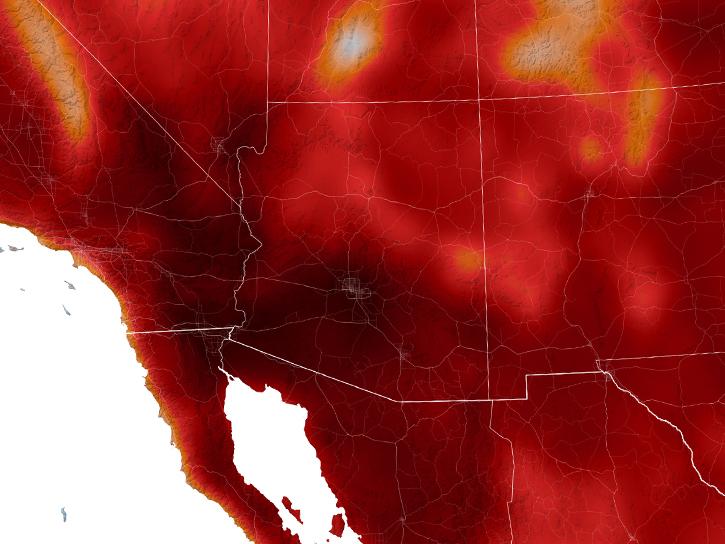
Read how Navajo Nation Climate III DEVELOP team used Earth observation data to investigate drivers of drought in the Southwestern United States.
Data in Action
June 14, 2017
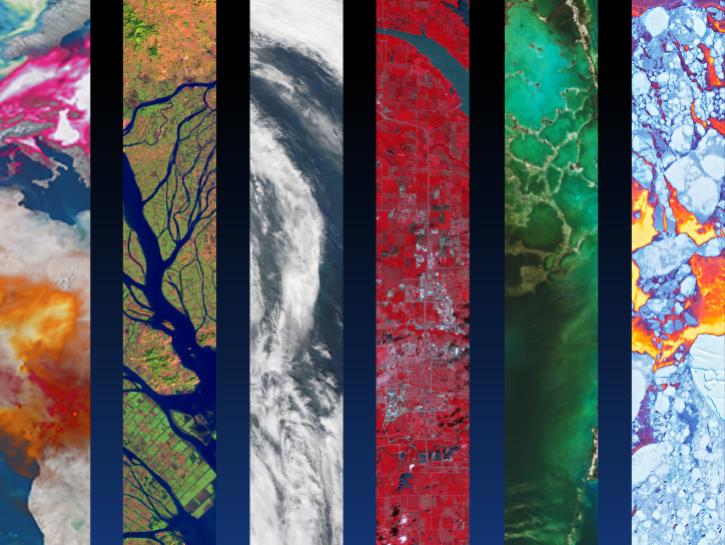
Read stories from the 2015 issue of Sensing our Planet to learn about the many uses of MODIS data distributed by LP DAAC.
Data in Action
June 1, 2016

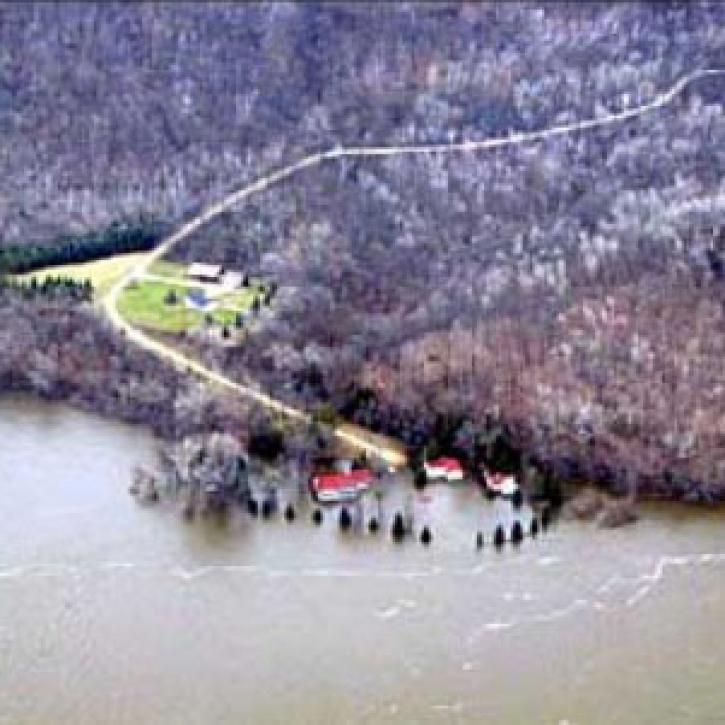
This ARSET training provides demonstrations and hands-on experience in using NASA remote sensing observations and flood mapping tools.
Training
March 16 - April 6, 2016
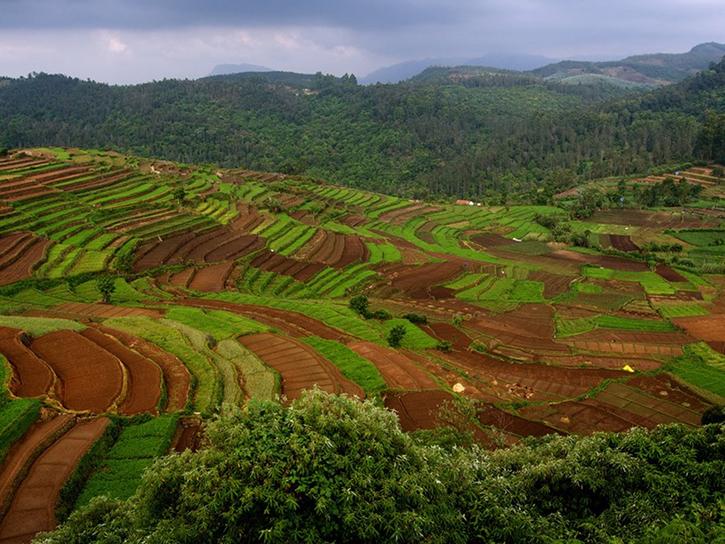
See how MODIS data are used to determine areas susceptible to water-stress to show the relative health of the vegetation compared to the same area with healthy vegetation.
Data in Action
June 25, 2015
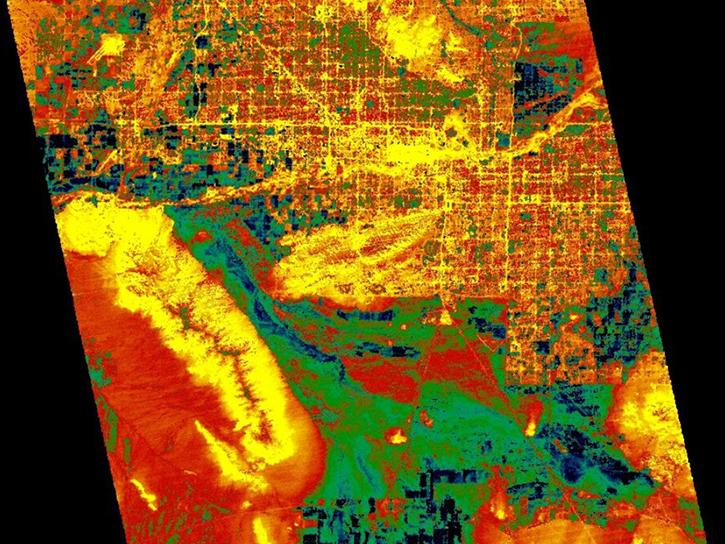
Explore how LP DAAC data was used to forecast spring wheat yields in Canada, track elevation change at a U.S. coal mine, and examine land cover impacts on urban heat in Phoenix, Arizona.
Data in Action
Nov. 25, 2014
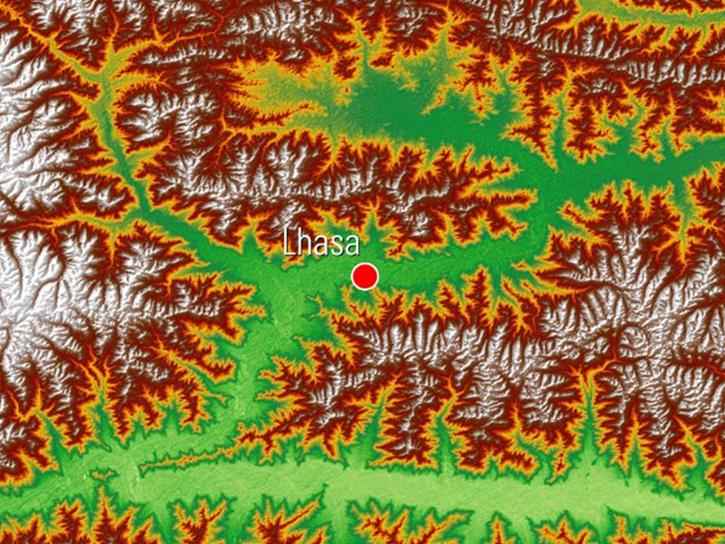
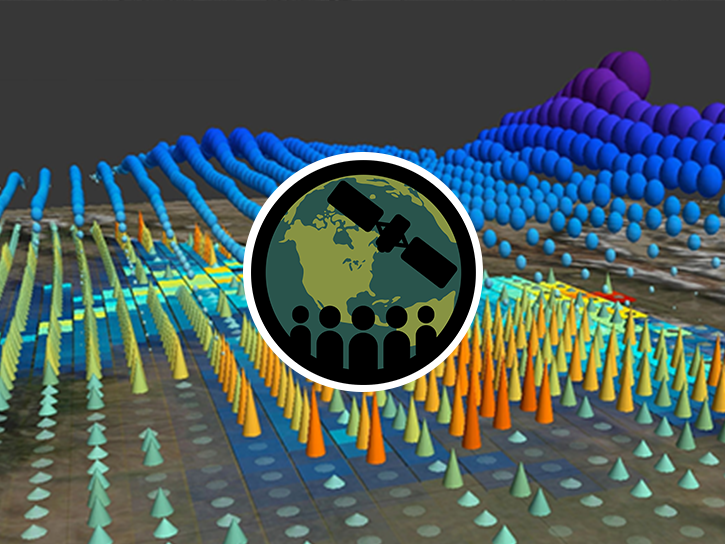
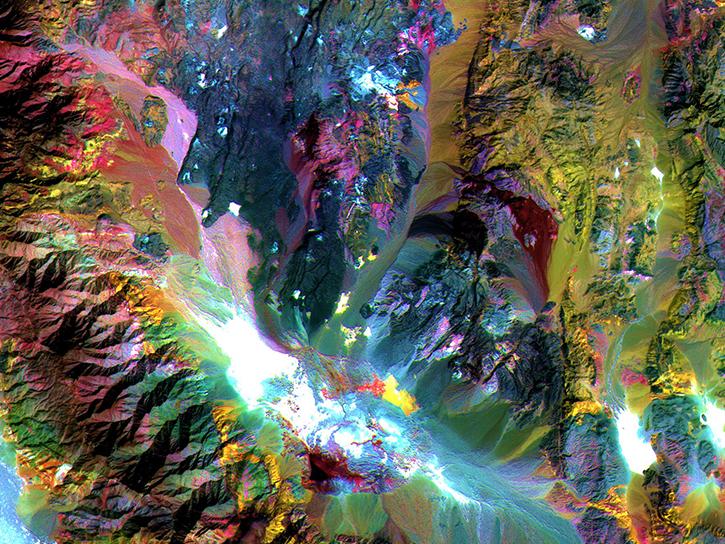
See how digital elevation models are used to create three-dimensional data visualizations, which provide an insightful perspective on landscapes.
Data in Action
Aug. 18, 2014
SHOWING 8 OF 32
A new long-term archive of satellite data will help hydrologists monitor floods, allow aid agencies to pinpoint flood-prone regions, and provide information for modeling Earth's complex hydrologic cycles.
Feature Article
July 28, 2020
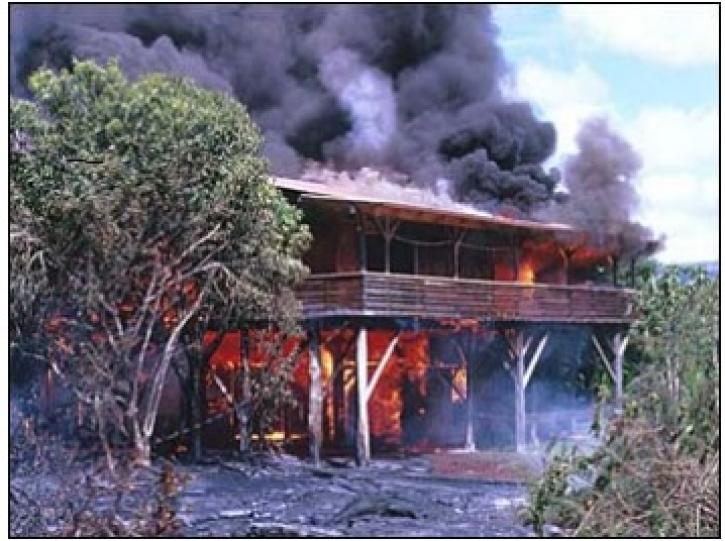
In October 2001, a volcano in the remote South Sandwich Islands began spewing ash and lava. Less than 24 hours after the eruption began, a research team nearly 9,000 miles away was estimating how much energy the volcano was producing.
Feature Article
July 28, 2020
These products are available globally at their full resolution of 30 meters per pixel.
Blog
Dec. 9, 2015
SHOWING 3 OF 15
Frequently Asked Questions
Earthdata Forum
Our online forum provides a space for users to browse thousands of FAQs about research needs, data, and data applications. You can also submit new questions for our experts to answer.
Submit Questions to Earthdata Forumand View Expert Responses