
Ocean currents are continuous water movements driven by wind, temperature and salinity variations, tides, Earth's rotation, and waves. These forces interact in complex ways, further shaped by seafloor topography, coastlines, and mixing between current systems.

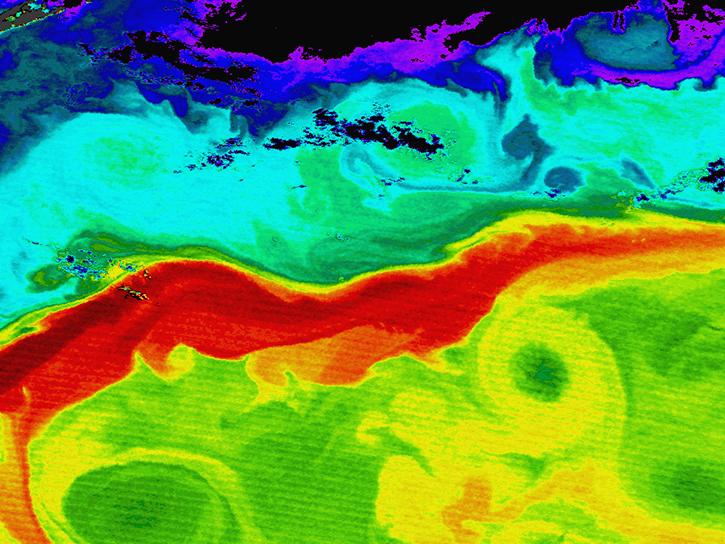
Some currents span entire oceans, forming a global conveyor belt that significantly influences regional climates. The Gulf Stream exemplifies this—it carries warm water from the Gulf of Mexico to northwest Europe, creating much milder temperatures than found elsewhere at those latitudes. Conversely, the California Current keeps Hawaii's climate subtropical rather than tropical.

Understanding ocean circulation is crucial for predicting weather and climate, and for studying how oceans redistribute heat, cycle nutrients essential for marine life, and affect ecosystem health.

NASA monitors ocean circulation using advanced technology including ocean gliders, buoys, and satellites like the Surface Water and Ocean Topography (SWOT) platform. NASA's archives contain diverse ocean circulation data, from wind doppler measurements to carbon calculations.

Get Ocean Circulation Data

Access a range of datasets and data tools to further your ocean circulation research.

Learn How to Use Ocean Circulation Data

Access webinars, tutorials, data recipes, and data stories to enhance your knowledge of Earth Observation data for studying ocean circulation.
This Jupyter Notebook workflow image shows an analysis-ready virtualized sea surface temperature dataset from NASA’s PO.DAAC loaded with Xarray on the left and a regional mean time series plot off the U.S. West Coast on the right.
Accelerating Science Using Virtualized Data at PO.DAAC
Learn how to use Python and Xarray to access virtualized, exploratIon- and analysis-ready physical oceanography datasets from NASA's PO.DAAC.
ocean temperature data
Moving Code to the Data: Analyzing Sea Level Rise Using Earth Data in the Cloud
Participants will learn how to discover and access physical oceanography data hosted in the Earthdata Cloud and apply AWS cloud computing to analyze global sea level rise.
ea Surface Height Anomaly (SSHA) from -30 cm (blue) to 30 cm (red) over the global ocean, arrows on top represent the ocean currents
Deep Learning Improves Global Satellite Observations of Ocean Eddy Dynamics
Artificial intelligence methods can be powerful tools to study our oceans.
A headshot of Dr. Fred Bingham Professor, University of North Carolina Wilmington, Department of Physics & Physical Oceanography. He is wearing a blue oxford shirt and posing before a turquoise background.
Data User: Dr. Frederick Bingham
Salinity data from NASA help Dr. Frederick Bingham study ocean dynamics.
Discover and Visualize Ocean Circulation Data
NASA data help us understand Earth's changing systems in more detail than ever before, and visualizations bring these data to life, making Earth science concepts accessible, beautiful, and impactful.
Data visualization is a powerful tool for analysis, trend and pattern recognition, and communication. Our resources help you find world-class data visualizations to complement and enhance your research. We also have tools and tutorials to help you translate ocean circulation data into compelling visuals.
Image
image of Africa with colors around the continent indicating sea surface temperature; coolest temperatures (blue) are at the southern tip of Africa; warmest temperatures (orange/red) are mid-continent.
The State of the Ocean (SOTO) product shows sea surface temperatures in Celsius around Africa on July 10, 2023. Blue indicates cooler temperatures; orange/red are warmer temperatures. Credit: NASA PO.DAAC.

Join Our Community of NASA Data Users

While NASA data are openly available without restriction, an Earthdata Login is required to download data and to use some tools with full functionality.

Learn About the Benefits of Earthdata Login

Frequently Asked Questions

Earthdata Forum

Our online forum provides a space for users to browse thousands of FAQs about research needs, data, and data applications. You can also submit new questions for our experts to answer.

Submit Questions to Earthdata Forumand View Expert Responses

Earthdata
Forum