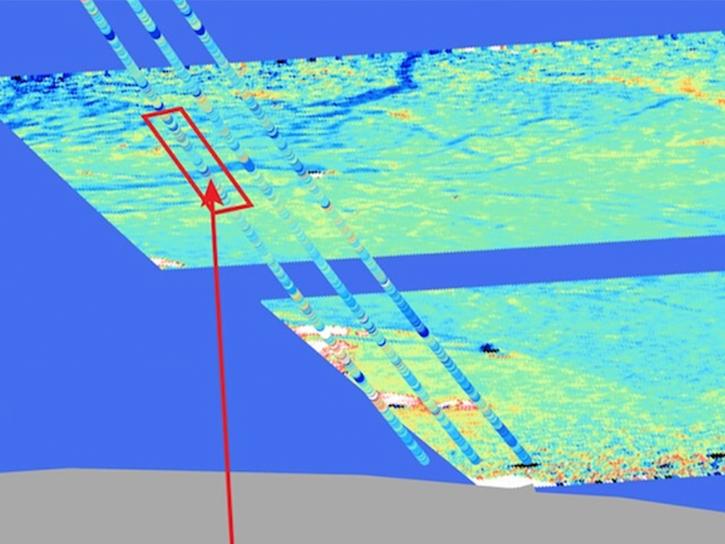
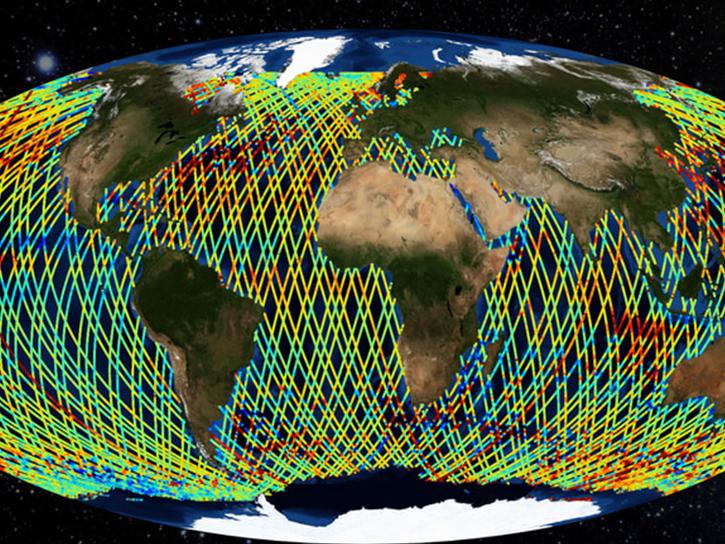
NASA data span the geophysical parameters that characterize the global ocean and the physical processes operating within its depths and at its surface. Our datasets and tools help researchers translate these interconnected data points into actionable knowledge.
Ocean Data Access and Tools
Ocean Datasets
| Dataset Sort descending | Version | Platform | Instrument | Temporal Extent | Spatial Extent | Spatial Resolution | Data Format |
|---|---|---|---|---|---|---|---|
| S-MODE Lagrangian Float Observations Version 1 | 1 | BUOYS | CTD, ADCP | 2022-10-01 to 2023-05-31 |
N: 38.1 S: 36.3 E: -122.9 W: -125.4 |
netCDF-4 | |
| S-MODE Level 3 Seaglider Observations Version 1 | 1 | SEAGLIDER | CTD | 2022-08-23 to 2023-07-07 |
N: 38.1 S: 36.3 E: -122.9 W: -125.4 |
netCDF-4 | |
| S-MODE Level 3 Shipboard uCTD and EcoCTD Measurements Version 1 | 1 | Ships | CTD | 2021-08-01 to 2021-11-30 |
N: 38.1 S: 36.3 E: -122.9 W: -125.4 |
netCDF-4 | |
| S-MODE Level 4 Wavegliders Version 1 | 1 | Wave Glider | CTD, ADCP, MMS, CURRENT METERS | 2022-09-20 to 2023-05-13 |
N: 37.9 S: 35.7 E: -121.9 W: -125.8 |
netCDF-4 | |
| S-MODE MOSES Level 2 Atmospherically-Corrected Sea Surface Temperature Version 1 | 1 | B-200 | RADIOMETERS | 2021-10-19 to 2023-05-05 |
N: 38.1 S: 36 E: -122.9 W: -125.4 |
netCDF-4 | |
| S-MODE NCOM Model Output Version 1 | 1 | MODELS | 2021-09-01 to 2023-08-01 |
N: 42 S: 30 E: -116 W: -130 |
netCDF-4 | ||
| S-MODE Pre-Pilot Ocean Wave Slope from Visible-Band Polarimetry at the Air-Sea Interaction Tower Version 1 | 1 | FIXED OBSERVATION STATIONS | STOKES POLARIMETER | 2019-10-07 to 2020-01-18 | netCDF-4 | ||
| S-MODE PRISM Level 1 Radiance and Ancillary Products Version 1 | 1 | G-III | PRISM | 2022-10-18 to 2023-05-10 |
N: 40 S: 35 E: -122 W: -130 |
netCDF-4 | |
| S-MODE PRISM Level 2 Water Surface Chlorophyll-a Version 1 | 1 | G-III | PRISM | 2022-10-19 to 2023-05-10 |
N: 40 S: 35 E: -122 W: -130 |
netCDF-4 | |
| S-MODE PRISM Level 2a Reflectance Version 1 | 1 | G-III | PRISM | 2022-10-19 to 2023-05-10 |
N: 40 S: 35 E: -122 W: -130 |
ENVI | |
| S-MODE Saildrone Level 1 Observations | 1 | Saildrone | ADCP | 2021-10-01 to 2022-11-30 |
N: 38.1 S: 36.3 E: -122.9 W: -125.4 |
netCDF-4 | |
| S-MODE Seaglider Observations Version 1 | 1 | SEAGLIDER | CTD | 2022-08-23 to 2023-07-07 |
N: 38.1 S: 36.3 E: -122.9 W: -125.4 |
netCDF-4 | |
| S-MODE Shipboard Bio-optical Measurements Version 1 | 1 | Ships | TRANSMISSOMETERS, FLUOROMETERS | 2022-10-09 to 2022-11-02 |
N: 42 S: 30 E: -119 W: -125.4 |
netCDF-4 | |
| S-MODE Shipboard uCTD and EcoCTD Measurements Version 1 | 1 | Ships | CTD | 2021-08-01 to 2023-05-31 |
N: 38.1 S: 36.3 E: -122.9 W: -125.4 |
netCDF-4 | |
| SMODE Shipboard Windcube LiDAR Observations Version 1 | 1 | Ships | MMS, WindCube | 2022-10-01 to 2023-05-06 |
N: 38.1 S: 36.3 E: -122.9 W: -125.4 |
NetCDF | |
| S-MODE Temperature and Salinity from NAVO Floats Version 1 | 1 | Argo-Float | CTD | 2023-04-01 to 2023-08-01 |
N: 38.1 S: 36.3 E: -122.9 W: -125.4 |
netCDF-4 | |
| S-MODE Temperature and Salinity from Slocum Gliders Version 1 | 1 | AUVS | CTD | 2021-08-01 to 2023-05-31 |
N: 38.1 S: 36.3 E: -122.9 W: -125.4 |
netCDF-4 | |
| Soil Moisture Active Passive (SMAP) L1-L3 Ancillary NOAA Data V001 | 1 | NOT APPLICABLE | NOT APPLICABLE | 2015-01-31 to Present |
N: 86.4 S: -86.4 E: 180 W: -180 |
netCDF-3, ASCII | |
| Sounder SIPS: AQUA AIRS IR + MW Level 2: Atmospheric state at Standard Pressure Levels derived from CLIMCAPS V2.1 (SNDRAQIML2PLEVCPS) | 2.1 | Aqua | AIRS | 2002-08-31 to 2016-09-25 |
N: 90 S: -90 E: 180 W: -180 |
||
| Sounder SIPS: AQUA AIRS IR + MW Level 2 CLIMCAPS: Atmosphere, cloud and surface geophysical state V2 (SNDRAQIML2CCPRET) | 2 | Aqua | AIRS, AMSU-A | 2002-08-30 to 2016-09-25 |
N: 90 S: -90 E: 180 W: -180 |
||
| Sounder SIPS: AQUA AIRS IR + MW Level 2 CLIMCAPS: Retrieved atmospheric state V2.1 (SNDRAQIML2CPS) | 2.1 | Aqua | AIRS, AMSU-A | 2002-08-31 to 2016-09-25 |
N: 90 S: -90 E: 180 W: -180 |
||
| Sounder SIPS: AQUA AIRS IR + MW Level 3 CLIMCAPS : Comprehensive Quality Control Gridded Daily V2 (SNDRAQIML3CDCCP) | 2 | Aqua | AIRS, AMSU-A | 2002-08-31 to 2016-09-26 |
N: 90 S: -90 E: 180 W: -180 |
1 Decimal Degrees x 1 Decimal Degrees | |
| Sounder SIPS: AQUA AIRS IR + MW Level 3 CLIMCAPS : Comprehensive Quality Control Gridded Monthly V2 (SNDRAQIML3CMCCP) | 2 | Aqua | AIRS, AMSU-A | 2002-08-31 to 2016-10-01 |
N: 90 S: -90 E: 180 W: -180 |
1 Decimal Degrees x 1 Decimal Degrees | |
| Sounder SIPS: AQUA AIRS IR + MW Level 3 CLIMCAPS: Specific Quality Control Gridded Monthly V2 (SNDRAQIML3SMCCP) | 2 | Aqua | AIRS, AMSU-A | 2002-08-31 to 2016-10-01 |
N: 90 S: -90 E: 180 W: -180 |
1 Decimal Degrees x 1 Decimal Degrees | |
| Sounder SIPS: AQUA AIRS IR MW Level 3 CLIMCAPS : Specific Quality Control Gridded Daily V2 (SNDRAQIML3SDCCP) | 2 | Aqua | AIRS, AMSU-A | 2002-08-31 to 2016-09-26 |
N: 90 S: -90 E: 180 W: -180 |
1 Decimal Degrees x 1 Decimal Degrees |
Surface Water and Ocean Topography (SWOT) Platform
SWOT provides detailed surface topography and monitors water body changes over time. The platform enables high-resolution ocean monitoring at 15-150 km spatial scales, tracking ocean currents, coastal dynamics, storm surges, and regional sea level changes. On land, SWOT measures water storage changes in lakes, reservoirs, rivers, and wetlands, supporting river discharge estimates for water resource assessment.
Ocean Data Tools
| Tool Sort descending | Description | Services | |
|---|---|---|---|
| AppEEARS | The Application for Extracting and Exploring Analysis Ready Samples (AppEEARS) offers a simple and efficient way to perform data access and transformation processes. | Search and Discovery, Subsetting, Customization, Downloading, Visualization | |
| CASEI | The Catalog of Archived Suborbital Earth Science Investigations (CASEI) is a comprehensive inventory of contextual information for NASA's Earth Science airborne and field campaigns. | Search and Discovery, Cataloging | |
| CyAN File Search | The CyAN File Search tool allows users to choose an area over the continental United States and Alaska to retrieve cyanobacteria datasets archived by the Cyanobacteria Assessment Network (CyAN) project. | Analysis, Search and Discovery, Visualization | |
| CyFi Explorer | CyFi Explorer enables users to view corresponding Sentinel-2 satellite imagery for each cyanobacteria estimate, and estimate cyanobacteria density. | Analysis, Search and Discovery, Visualization | |
| Giovanni | Giovanni is a web application for accessing, visualizing, and analyzing Earth science remote sensing data without downloading the data. | Search and Discovery, Analysis, Access, Visualization, Downloading, Subsetting | |
| Hydrocron | Hydrocron is an API that repackages hydrology datasets from SWOT into formats that make time-series analysis easier. | Subsetting, Visualization | |
| Ocean Color Level 3 and 4 Browser | The Ocean Color Level 3 and 4 Browser allows users to view, download, or order global composites at various spatial and temporal scales (level 3) or get results from analyses of lower-level data (level 4). | Analysis, Search and Discovery, Visualization | |
| Panoply | Panoply is a cross-platform application that plots geo-referenced and other arrays from netCDF, HDF, GRIB, and other datasets. | Visualization, Customization, Reformatting, Subsetting, Comparison | |
| SeaBASS | SeaBASS is public archive of ocean and atmosphere data captured in situ. The archive is maintained by NASA's Ocean Biology Processing Group (OBPG). | Downloading | |
| SeaDAS | Sea, earth, atmosphere Data Analysis System (SeaDAS) is a comprehensive image analysis package for the processing, display, analysis, and quality control of ocean color data. | Analysis, Visualization, Processing |
Frequently Asked Questions
Earthdata Forum
Our online forum provides a space for users to browse thousands of FAQs about research needs, data, and data applications. You can also submit new questions for our experts to answer.
Submit Questions to Earthdata Forumand View Expert Responses