What a Difference an Hour Makes

TEMPO's hourly scans of North America are revolutionizing air quality monitoring across the continent.
Image
Image Caption

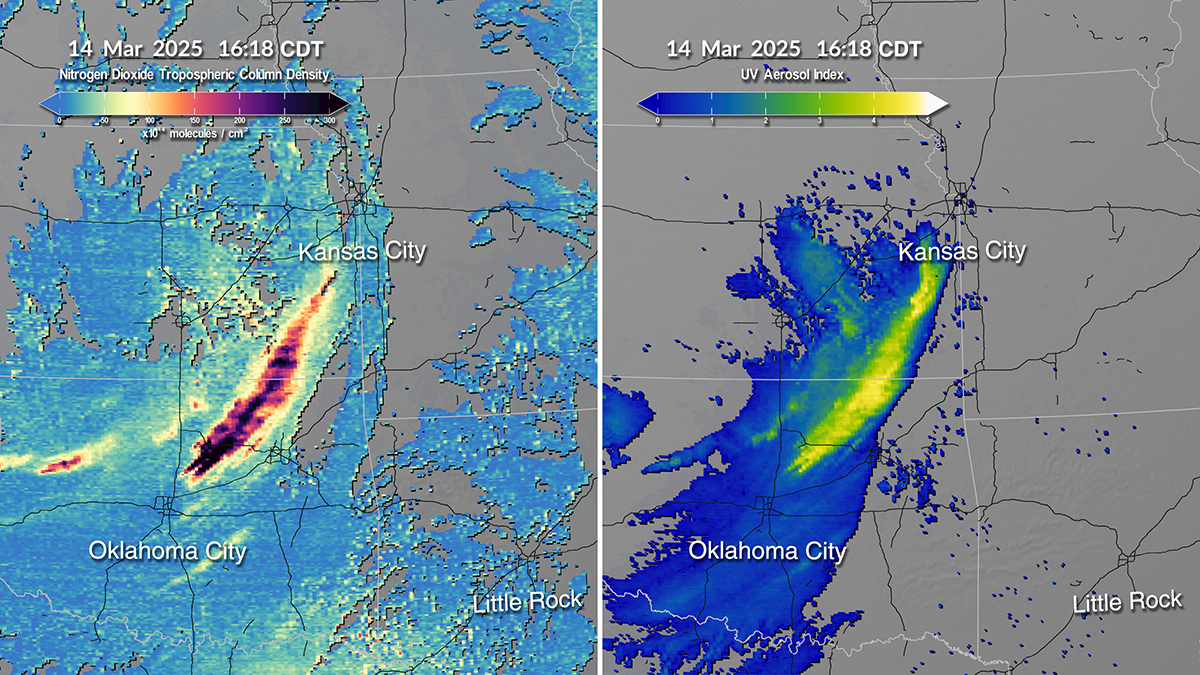
This visualization shows a dust and wildfire event near Kansas City on April 14, 2025. On the left, hourly TEMPO data captures nitrogen dioxide plumes from grassland fires; on the right, the ultraviolet aerosol index indicates particulates in the atmosphere that absorb UV light, such as dust and smoke. Credit: NASA's Scientific Visualization Studio

As NASA’s Tropospheric Emissions: Monitoring of Pollution (TEMPO) was launched into space in April 2023, researchers hoped it would be the next great tool for air quality monitoring. From its orbit 22,000 miles above Earth, the instrument offered a truly new way to measure atmospheric gases and pollutants over North America.

Day and night, officials and scientific experts from Minnesota to Europe are finding TEMPO data gives them access to air quality observations that are more comprehensive, frequent, and timely than ever before. In turn, users of the data are now able to see pollution in new ways to better protect the health of people. 

“TEMPO gives us coverage every hour of the day across the continent,” said John Haynes, NASA’s program manager for Health and Air Quality applications and TEMPO’s program application lead. “It’s revolutionary as our first geostationary air quality satellite, and I think it has exceeded expectations.”

TEMPO’s Baseline Data

The TEMPO instrument is a grating spectrometer sensitive to visible and ultraviolet light. The sensor is installed on the Earth-facing side of the Intelsat 40e (IS-40e) commercial communications satellite, which hovers over Earth in geostationary orbit. TEMPO’s resolution is nearly 2 x 5 km per pixel, making it useful for measuring air quality from the scale of neighborhoods to an entire continent. 

The instrument’s superpower is that it makes hourly scans of North America. Before TEMPO, data were only gathered in snapshots by satellites passing overhead about once a day. And if clouds were present at the time of the pass, little or no data might be gathered that day. With TEMPO’s hourly scans, clouds often move out of the way, providing more chances for clear-sky measurements. 

“With TEMPO, experts can now track how pollutant levels vary throughout the daytime, such as during and after traffic rush hours,” said Caroline Nowlan, TEMPO team scientist from the Harvard & Smithsonian Center for Astrophysics. “They also can get a more accurate picture of what’s in the air, how it changes, and can even locate emissions sources.”

Together, the data resolution and frequency allow experts to track gases and aerosols—across a day and as they move through the atmosphere—in finer and more frequent detail than ever before. 

For the first phase of TEMPO’s mission, the sensor was programmed to make daylight measurements of gases and aerosols important to air quality and atmospheric composition and to track how they move. These measurements included:

  • tropospheric and total column ozone
  • tropospheric and total column nitrogen dioxide (NO2)
  • total column formaldehyde
  • cloud cover and height
  • aerosol index

These baseline datasets are produced once a day and can be found on the TEMPO Data Access and Tools webpage. Some TEMPO datasets—including NO2, formaldehyde, cloud, and aerosol measurements—are also available in near real-time (NRT). 

“Our users have been asking for faster access to these measurements, and now it takes only about 2 to 2 1/2 hours to produce the NRT data,” said Nowlan. 

So far, the TEMPO NRT dataset includes more than 413 terabytes of data. And it is proving to be very popular. Since its creation, hundreds of users have downloaded more than 3.5 million TEMPO NRT files. Overall, users are downloading more than three million gigabytes of TEMPO data per year.

“In just three years, we have moved from what TEMPO will do to what TEMPO is actually delivering,” said Hazem Mahmoud, the project scientist for NASA’s Atmospheric Science Data Center (ASDC), which hosts TEMPO’s data. “The numbers show that users are adopting TEMPO data at scale.”

Since the first release of data, the TEMPO team has trained hundreds of people to find, access, and apply it. The training explains which pollutants TEMPO observes, why they matter for health, and how to access and visualize the data using tools and services that we provide.

When people can use the data themselves, Mahmoud noted, TEMPO's importance grows well beyond the science team.

Health Research and Policy Applications

Researchers care about air quality because of its effects on public health and on our planet. Air pollution is widely implicated in the onset of chronic diseases such as asthma and cancer. On the dirtiest days, air pollution is a trigger for heart attacks, emergency room visits, and deaths.

“With TEMPO, we strive to make sure the data are connected with epidemiologists, public health officials, and policymakers who can use it for important research and decision-making to improve and protect lives,” said Haynes. 

One of the ways NASA and TEMPO are making those connections is through the Health and Air Quality Applied Sciences Team. HAQAST works in partnership with researchers, as well as public health and air quality agencies, to help them use NASA satellite data to solve real-world pollution problems. 

For example, HAQAST is funding research led by the University of Iowa to add TEMPO data to a wildfire smoke tracking system called FireAQ. Originally developed with NASA funding prior to TEMPO’s launch, FireAQ combines NRT Tropospheric Monitoring Instrument (TROPOMI) satellite data with computer modeling to make wildfire smoke forecasts. The forecasts are for use by federal, state, and local agencies, such as the National Oceanic and Atmospheric Administration. Now that TEMPO is flying over North America, FireAQ is being enhanced with that data, too.
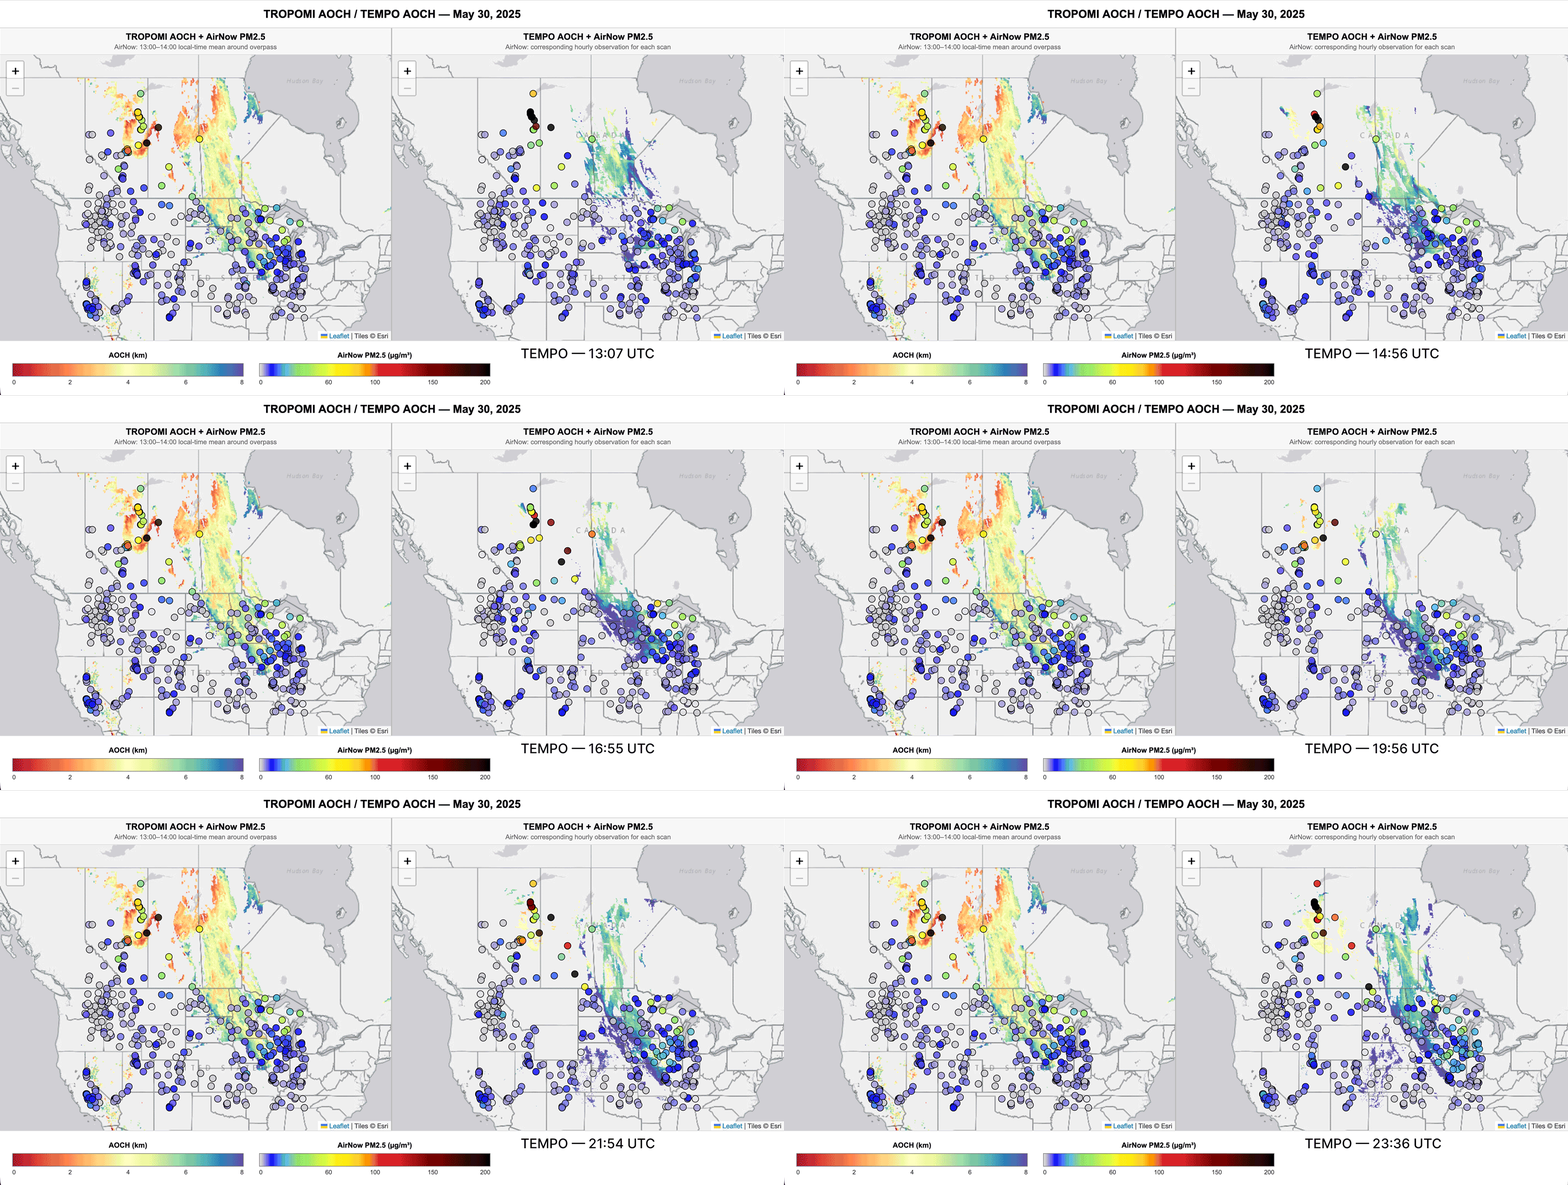
Two views of Canadian wildfire smoke moving across North America. The view on the left is a static image from the TROPOMI sensor. The animation on the right is from TEMPO and shows how the plume moves across the region.
Caption

This visual comparison shows observations from the TROPOMI and TEMPO sensors on May 30, 2025, when there were large wildfires burning in Canada that sent smoke deep into the U.S. The animation highlights TEMPO’s unique capability to continuously monitor a smoke plume’s development and travel throughout the day. Credit: Xi Chen

“TROPOMI only measures each surface location once per day in the early afternoon,” said Xi Chen, an assistant research scientist at the University of Iowa and one of the leaders of FireAQ development. “TEMPO can measure the smoke plume heights every hour over the continental U.S., which is very helpful for monitoring the rapid transport of smoke plumes during a day.”

Measuring smoke plume heights allows air quality experts to determine how close a pollutant comes to the ground level, where people could breathe it. The addition of TEMPO data will allow FireAQ to model smoke plumes in three dimensions, making it easier to determine if they’re a threat to communities in their path.

Federal, State, and International Agencies Using TEMPO

Users of TEMPO data come from a variety of sectors, including U.S. and international agencies such as the Environmental Protection Agency and the European Center for Medium-Range Weather Forecasting (ECMWF). State governments across the U.S. use TEMPO data for air quality modeling and forecasts, too. 

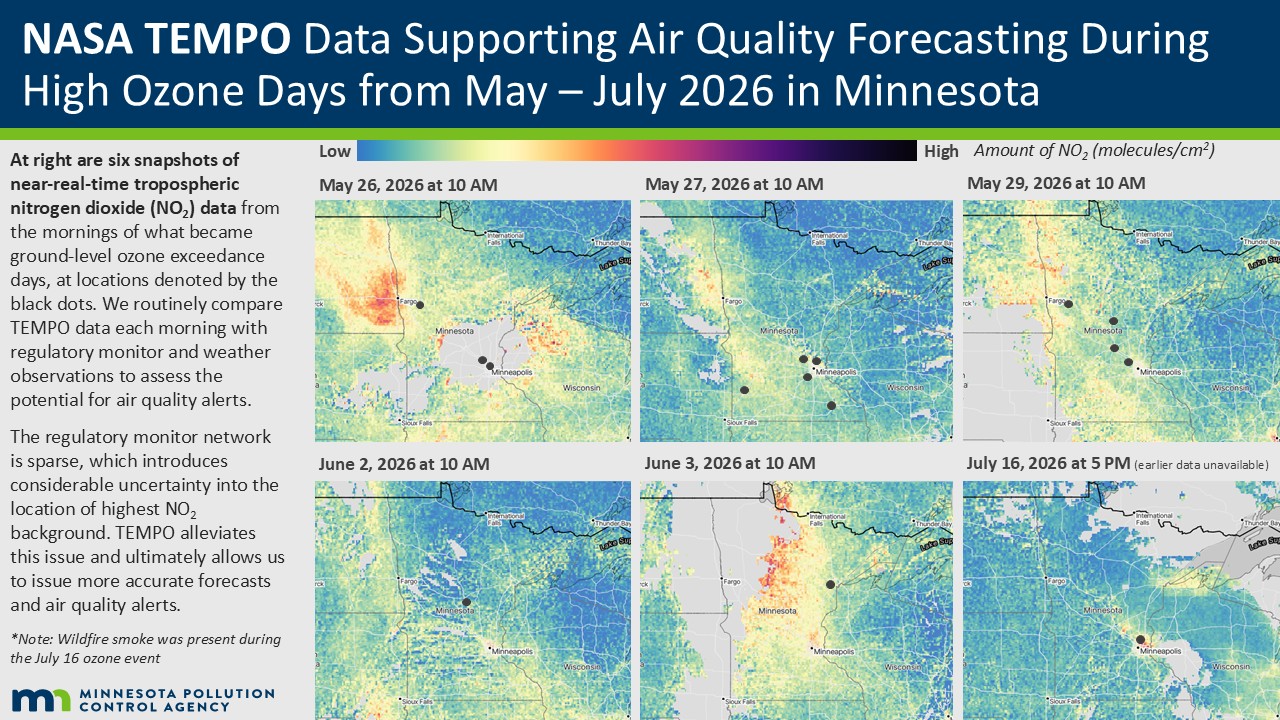
A good example is Minnesota, where meteorologists in the state’s pollution control agency use TEMPO data extensively to see what kind of ozone gas precursors—such as NO2 and volatile organic compounds (VOCs)—are in the atmosphere. 

Image
Image Caption

This presentation slide from the Minnesota Pollution Control Agency explains how the state compares TEMPO NO2 with ground monitoring and weather data to assess the need for air quality alerts. TEMPO data helps fill gaps in monitoring network measurements, creating more confidence in the agency's forecasts and alerts. Credit: Minnesota Pollution Control Agency

“This data is a game changer for us,” said Matt Taraldsen, the supervisory meteorologist for the agency’s air modeling unit. “It has really challenged what we thought we knew about the atmospheric chemistry and ozone formation process here.”

Minnesota’s surface monitoring network is very sparse, with most sensors in urban areas. This means there aren’t a lot of good data for rural areas of the state where ozone and its related gases can often begin to form. Without those measurements, it is harder to create accurate ozone forecasts. To make up for the lack of ground measurements, Taraldsen and his team use TEMPO to track ozone precursors by satellite and then use the observations to augment their air pollution forecasting.

“Before TEMPO, our data network would show elevated levels of ozone only around the Twin Cities, but now we are seeing ozone generation is actually in a larger footprint around the state,” said Taraldsen. 

In the summer of 2026, TEMPO’s data were deciding factors in the state’s decision to issue air pollution health alerts on two occasions. “That extra data gave us higher confidence in issuing an alert, and we were able to do it earlier than we would have using our legacy data,” said Taraldsen.

Increasing the TEMPO

TEMPO is only three years into its mission and could last up to 10 to 15 more years. To expand the reach and utility of the relatively young mission, TEMPO’s data, applications, research, and technology teams will soon add a number of products requested by federal agencies collaborating with NASA. Those data products include sulfur dioxide, aerosol height, water vapor, bromine monoxide, soil nitrogen dioxide, and other measurements.

One particularly notable new dataset is an ultraviolet-ultraviolet-B (UV-UVB) radiation index. This index, measuring the intensity of UV radiation at the ground every hour, will be an important tool for public health experts to more accurately update UV forecasts and help reduce sunburn and skin cancer risk.

In addition to increasing TEMPO’s air quality observations, researchers are exploring its ability to observe nighttime lights. For example, TEMPO can detect city lights, nightglow, gas flares, and lightning from storms, and it offers the unique ability to discern incandescent, LED, and other lighting types. This night vision could be used in tandem with NASA’s Black Marble dataset for studies of how light pollution affects human and animal health, energy usage, and other topics. 

While TEMPO has already accomplished a lot in a few years, its mission has only just begun. The instrument is delivering the advanced air quality data researchers sought for years before its 2023 launch, with even more achievements to be realized, every hour, in the years to come.


Editor's Note: TEMPO NRT products are funded by NASA and are a deliverable of the Satellite Needs Working Group (SNWG), an interagency effort of the U.S. government dedicated to identifying and addressing Earth observation needs across U.S. civilian federal agencies.

Details

Last Updated

Nov. 9, 2026

Published

Nov. 9, 2026

Data Center/Project

Atmospheric Science Data Center (ASDC)