Enhanced Tools for Interannual and Monthly Comparisons of Burned Area

The FIRMS burned area user interface allows users to simultaneously display and compare individual monthly burned area products as well as monthly products aggregated into annual datasets.

The Fire Information for Resource Management System (FIRMS) recently updated the user interface for manipulating and displaying the 500 m Moderate Resolution Imaging Spectroradiometer (MODIS) Burned Area product (MCD64A1) in the map viewer for FIRMS Global and FIRMS US/Canada. This will enable users to interrogate the data further and inform questions such as: which areas consistently burn year after year and burn at the same time of year? Which most recently burned areas are adjacent to previously burned areas? Are there some areas that are more susceptible to burning due to their location next to a previously burned area? Is there a relationship between the timing and amount of area burned relative to climate cycles or extremes?

The MODIS burned area product is compiled as a monthly dataset that spans the entire MODIS data record (late 2000 to present). Previously, FIRMS users could display one or more of the 12 monthly datasets for a selected calendar year. The updated burned area user interface allows users to simultaneously display and compare individual monthly burned area products, as well as monthly products aggregated into annual datasets for one to three user-selected years. The updated interface is accessible in the "Advanced Mode" and "Burned Area" mode of the FIRMS map viewer.
Image
Image Caption

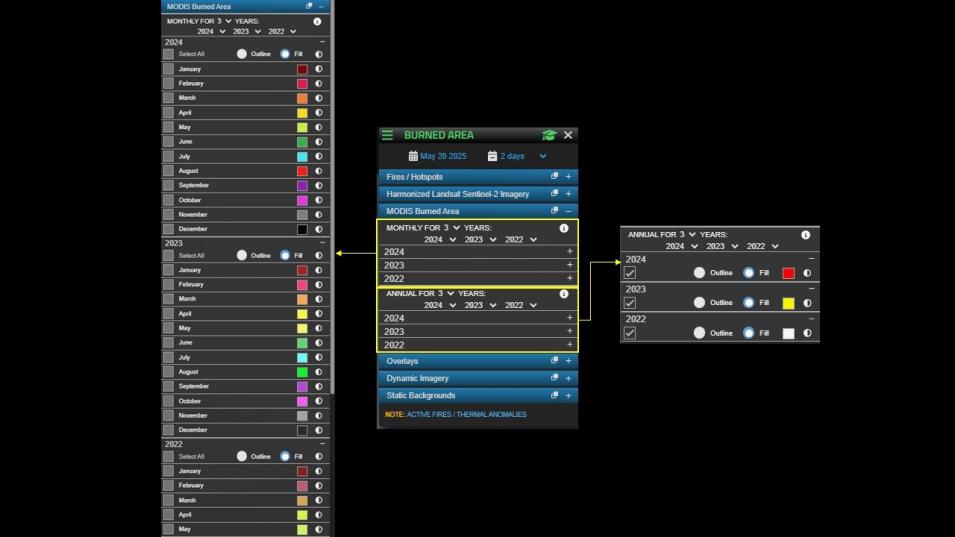
Figure 1. Monthly (left) and annual (right) display options in the updated user interface for the MODIS burned area product in the FIRMS map viewer (available in FIRMS Global and FIRMS US/Canada). Monthly or annual burned area products can be displayed for one year or up to three years.

Monthly Display Option

The monthly display option for the MODIS burned area product works similarly to the previous burned area user interface with the exception that users can now view monthly burned area data for one, two, or three years (see the illustration on the left in Figure 1). To view the monthly burned area data for a single year, use the default setting of "Monthly for 1 Years" and select the desired year. To simultaneously view monthly burned area data for multiple years, select the number of years to use and then select the desired calendar years. It should be noted that a time series analysis is conducted to generate the burned area product. This analysis uses several inputs including the daily surface reflectance imagery and active fire detection data for the targeted month as well as the last 10 days of the previous month and the first 10 days of the subsequent month. For example, the burned area product for the month of July requires daily surface reflectance imagery and active fire detection data for all 31 days of that month in addition to the last 10 days of June and first 10 days of August. Consequently, the result is a 2-3 month lag before the burned area data are accessible in FIRMS (when this blog was posted in August 2025, the products for January - May of that year were available).

By default, the colors used to symbolize the individual monthly burned area datasets are the same for each year; the symbology color or opacity can be changed to render the desired visualization. For example, in Figure 2, the area burned for the month of August in 2024, 2023, and 2022 in the Banhine National Park in southern Mozambique is displayed as red, green, and blue, respectively. To change the color of any month, click on the default color and select your preference from the color wheel. Any of the monthly burned area datasets can be displayed for the selected years. This visualization shows that in August 2022 there was significantly more area burned compared to August 2023 or August 2024.

Image
Image Caption

Figure 2. Monthly MODIS burned area data for the month of August in 2024 (red), 2023 (green), and 2022 (blue) in the Banhine National Park in southern Mozambique. View Figure 2 imagery in FIRMS.

Annual Display Option

Users can manipulate and visualize the burned area data for an entire year using the "Annual" option. To manipulate the annual display option, select the years of interest to display — up to 3 different years can be displayed. Users can also adjust the symbology. As an example in Figure 3, the burned area for two years containing the largest Siberian wildfire events in living history are displayed: year 2003 (22 million hectares/55 million acres) in yellow and year 2020 (25.5 million hectares/63 million acres) in red. The layers are displayed with a 50% opacity so that the extent of each year’s burned area can be discerned and areas that burned in 2003 and reburned in 2020 are visible. The annual MODIS burned area datasets are value-added products created by the FIRMS team by aggregating the monthly datasets for each calendar year into a single annual dataset.

Image
Image Caption

Figure 3. Eastern Siberia MODIS burned area data for 2003 (yellow) and year 2020 (red). The data are displayed with a 50% opacity setting so areas of reburn in 2020 are discernible. View Figure 3 imagery in FIRMS.

Other Notable Items About Burned Area Products in FIRMS

  • As with the previous MODIS burned area user interface, the solid fill symbology of the data can be manipulated and users can display individual burned area datasets as polygon outlines with a user-selected color.
  • When measuring and assessing area burned, users are encouraged to use the MODIS burned area products instead of active fire detection data. This is due to temporal and spatial sampling issues with satellite observations and the methodology applied to delineate burned areas. Please see the FIRMS FAQsCan I estimate burned area from active fire data?” and "Where can I get the MODIS burned area product?" for more information.
  • Additionally, the FIRMS team has now released the Visible Infrared Imaging Radiometer Suite (VIIRS) burned area product (VNP64A1) in the FIRMS map viewer. This 500 m product, based on Suomi National Polar-orbiting Partnership (Suomi NPP) VIIRS data, extends from 2012 to present and is accessible in the ADVANCED MODE and BURNED AREA mode of the FIRMS map viewer. The VIIRS burned area product provides temporal overlap with a significant portion of the MODIS burned area product record and provides continuity including, in due course, the integration of VIIRS data from NOAA-20 and NOAA-21.

Details

Last Updated

Sept. 10, 2025

Published

May 20, 2025