We are in the process of migrating all NASA Earth science data sites into Earthdata from now until end of 2026. Not all NASA Earth science data and resources will appear here until then. Thank you for your patience as we make this transition.
Read about the Web Unification Project
Data Recipes
Follow one of our data recipes to accomplish a specific task, such as converting data into a certain format for analysis or visualization.
Featured Data Recipes

3 MIN READ
Learn how to create a time-enabled multidimensional mosaic dataset using GeoTIFF/COG files within the GIS desktop program ArcGIS Pro.
Nov. 17, 2025
11 MIN READ
Learn how to phase unwrap an interferogram in this data recipe from NASA’s Alaska Satellite Facility Distributed Active Archive Center (ASF DAAC).
Oct. 18, 2024
Filters
3 MIN READ
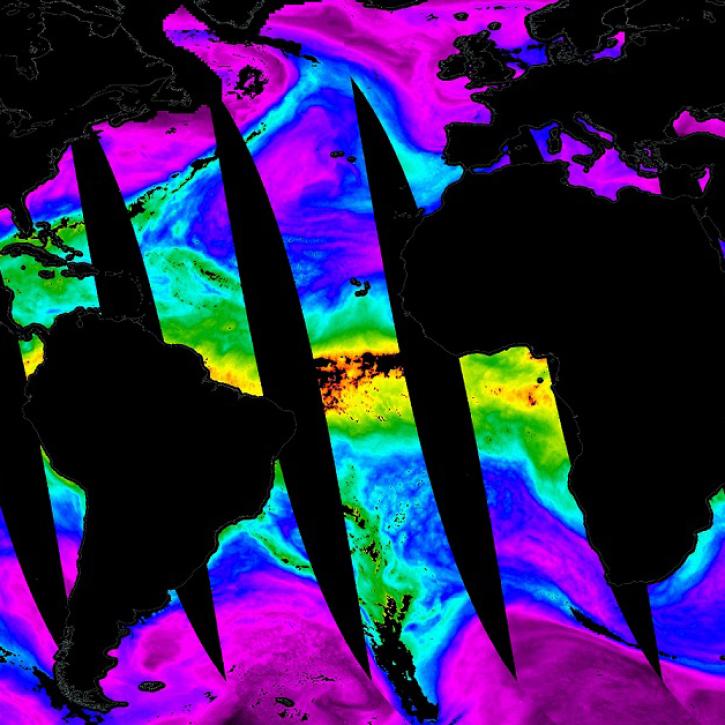
Learn how to access and visualize NASA's Advanced Microwave Scanning Radiometer HDF-EOS5 Point product in Python via OPeNDAP.
May 31, 2024

13 MIN READ
Learn how to acquire HARP2 data, plot geolocated imagery, and make animations of multi-angled data.
May 20, 2024
8 MIN READ
Learn how to generate time-height plots of measured Cloud Radar System radar reflectivity and Doppler velocity through a Python 3 plotting routine.
Jan. 9, 2023
6 MIN READ
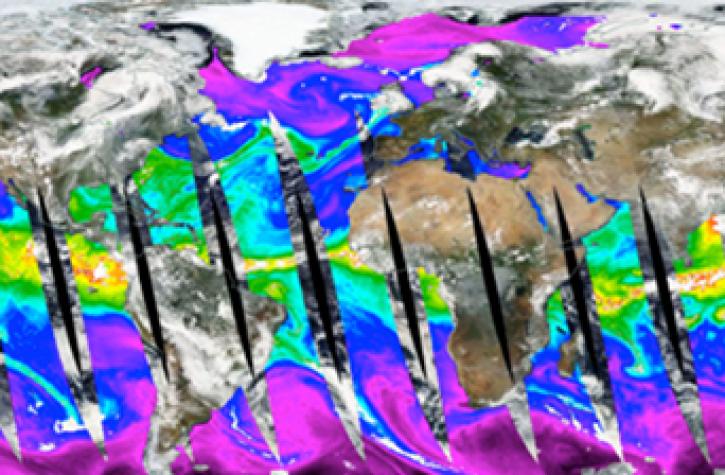
Learn how to use Python to convert near real-time (NRT) data from NASA's Advanced Microwave Scanning Radiometer 2 (AMSR2) instrument provided by the Land, Atmosphere Near real-time Capability for Earth Observing Systems (LANCE).
Dec. 8, 2022
5 MIN READ
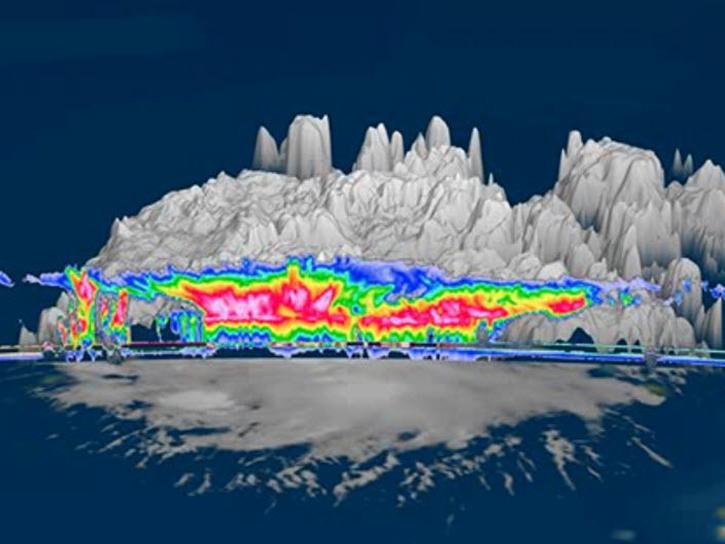
Learn how to generate a time-height plot of the measured Hurricane and Severe Storm Sentinel (HS3) High-Altitude Imaging Wind and Rain Airborne Profiler (HIWRAP) radar reflectivity through a Python plotting routine.
Dec. 2, 2022

13 MIN READ
This data recipe guides the user through a Python script that enables visualization of Optical Transient Detector (OTD) lightning flash locations.
Dec. 2, 2022

5 MIN READ
This data recipe instructs users on how to generate vertical time-height plots of Hurricane and Severe Storm Sentinel (HS3) Global Hawk Cloud Physics Lidar (CPL) attenuated total backscatter measurements using a Python plotting routine.
Dec. 1, 2022
4 MIN READ
This data recipe enables users to plot temporal subsets of the HS3 High Altitude MMIC Sounding Radiometer (HAMSR) Radar Reflectivity Profiles through a Python plotting routine.
Dec. 1, 2022
SHOWING 8 OF 61