Introduction

Off the coast of Florida, the Gulf Stream sheds swirls of water only a few kilometers wide that spin off, drift, and disappear within days in the Atlantic Ocean. Oceanographers call these short-lived whirlpools submesoscale eddies, and for decades they were dismissed as background noise—too small to matter for understanding big ocean currents like the Gulf Stream. 

That view has changed, thanks to numerical ocean models and a small number of challenging field campaigns through which scientists discovered that these small eddies (generally less than 10 km across) actually play a vital role in the global ocean circulation. They help move energy between large- and small-scales, pull carbon out of the atmosphere and down into the deep ocean, and mix the upper ocean. These small scales are also where the ocean’s microscopic plant-like organisms, called phytoplankton, are sustained by nutrient-rich water pulled up from the depths. Phytoplankton form the center of the marine food web and, through photosynthesis, produce a significant amount of the oxygen we breathe.

Submesoscale ocean dynamics have long been situated in an observational blind spot – too small to see from space, too big and quick to record by ship. Conventional satellite altimeters, which measure sea surface height from space, cannot resolve submesoscales. Ocean color satellites take a different approach, detecting subtle shifts in the sea surface's color—greener where chlorophyll, the pigment phytoplankton use to capture sunlight, is more concentrated—to estimate how much chlorophyll is present in submesoscale eddies, though not which phytoplankton species produced it. 

Frontal eddies, which form along the edges of western boundary currents like the Gulf Stream, are particularly difficult to observe because they occur intermittently and are pulled along quickly by the fast currents that spawned them.

Now, a new generation of NASA satellite missions is closing these observational gaps, and, for the first time, several satellites can look at the same patch of ocean on the same day in high spatial resolution. 
Image
Image Caption

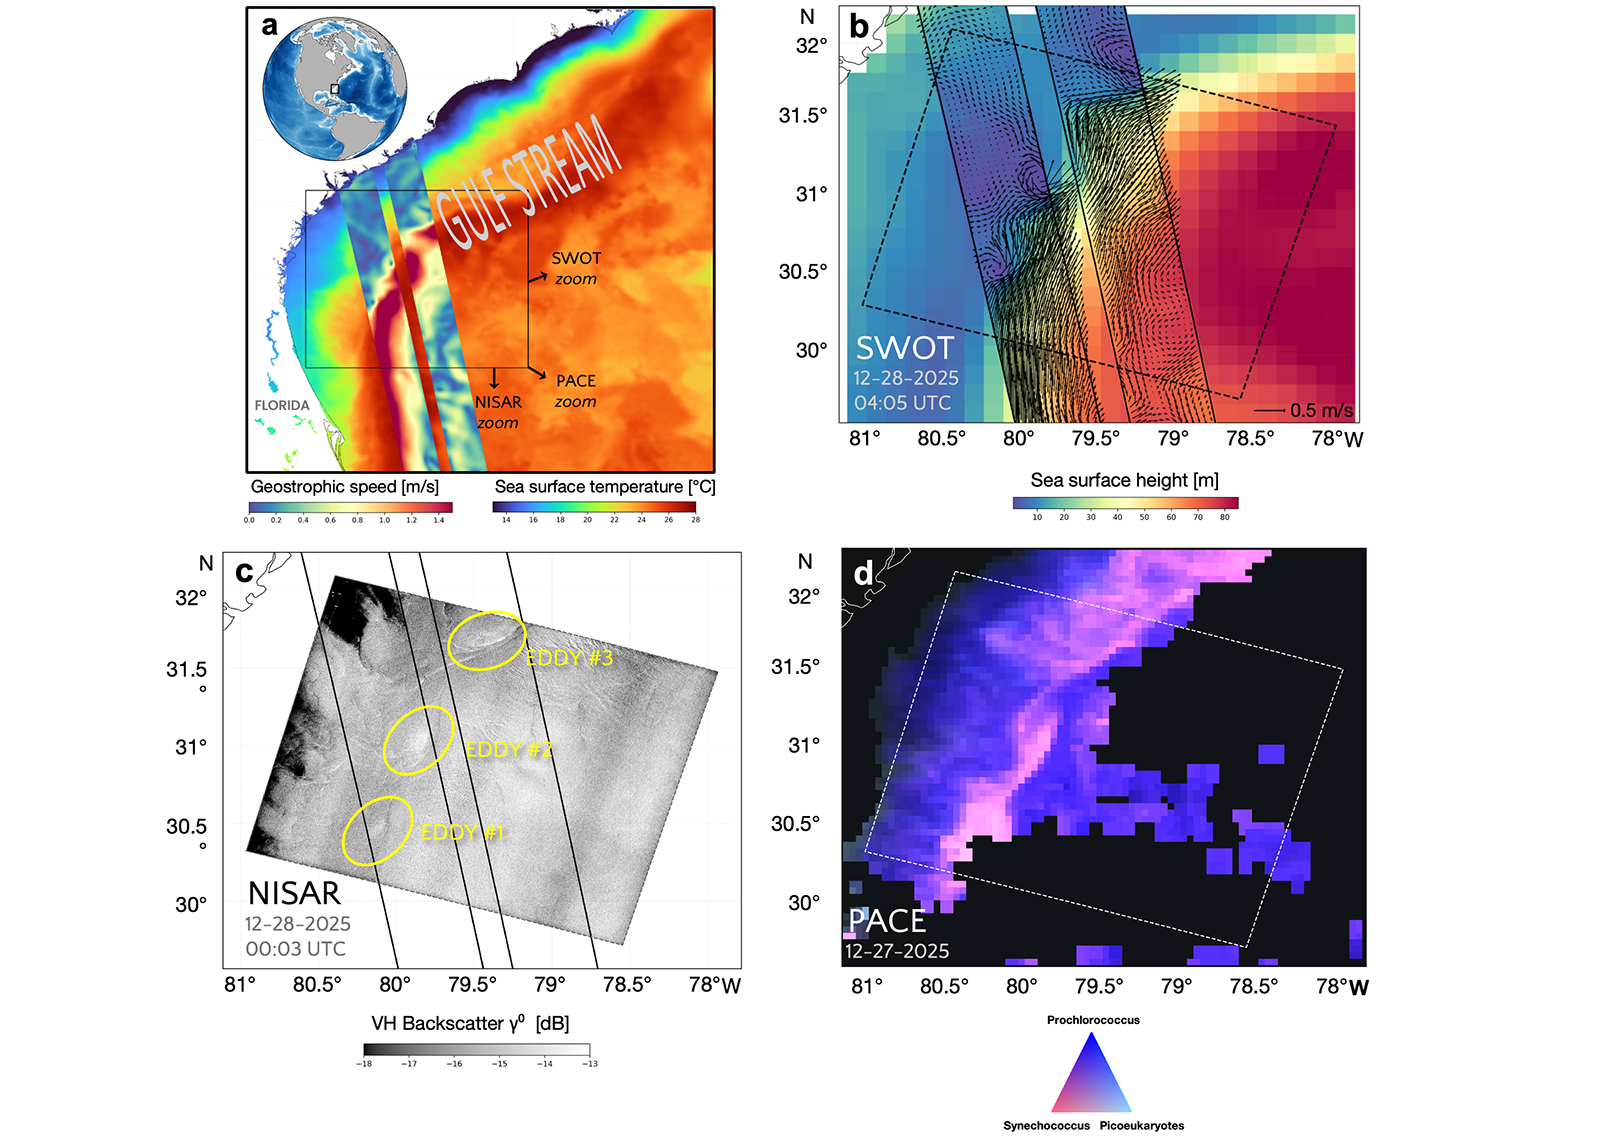
Figure 1: Gulf Stream eddies on December 28, 2025 along the Florida coast, viewed by four satellites within six hours. (a) Sea surface temperature with a swath of SWOT ocean current speed data laid on top; black box marks the region enlarged in (b)-(d). (b) SWOT map of sea surface height and ocean currents direction, revealing where the water is swirling. (c) NISAR’s radar image of sea surface roughness (grayscale), brighter and darker patches trace the same eddies using a completely different kind of measurement. (d) Map of three phytoplankton types from PACE (triangular color key) showing which aquatic species are thriving where. 

Using SWOT, PACE, and NISAR to Watch the Submesoscale Ocean

On the December 28, 2025, several frontal eddies were mapped by a series of satellites within 6 hours, as shown in Figure 1. Three of those satellites are NASA's new flagship Earth-observing missions: SWOT, PACE, and NISAR.

SWOT (Surface Water and Ocean Topography) measures the height of the sea surface with enough resolution to map eddies just a few kilometers wide, far smaller than the ocean features conventional altimeters are capable of capturing (100 km or larger). It does this with a trailblazing instrument called Ka-band Radar Interferometer (KaRIn) that maps sea surface height in unprecedented precision over two swaths rather than a single narrow track like conventional altimeters. Small bumps and dips in the sea surface reveal where water is swirling into an eddy. SWOT was launched in December 2022 by NASA and CNES, the French space agency.

NISAR (NASA–ISRO Synthetic Aperture Radar) bounces a radar signal off the sea surface and measures how much of it bounces back in the direction of the satellite, a property called backscatter. Rough water reflects radar differently than smooth water, so the swirling currents at an eddy’s edge show up as brighter or darker patches in NISAR’s images. That gives scientists an independent way to spot the same eddies that SWOT sees, using a different kind of measurement. 

NISAR is the first satellite to carry both an L-band and an S-band radar. Launched in July 2025, this joint mission of the United States and India began routine operations in January 2026, making this December 2025 image (Figure 1c) one of its earliest views of the ocean.

PACE (Plankton, Aerosol, Cloud, ocean Ecosystem) and its Ocean Color Instrument see the ocean in much finer detail than earlier satellites, observing in hundreds of narrow wavelength bands instead of just a few broad ones. Different phytoplankton species tint the water in subtly different ways, so this level of detail lets PACE do something earlier ocean color satellites could not: tell species apart. The MOANA (Multi-Ordination ANAlysis) data product shown here (Figure 1d) maps the abundances of ProchlorococcusSynechococcus, and picoeukaryotes—picophytoplankton so small (under about 2-3 micrometers) that dozens could line up across the width of a single human hair. 

Distinguishing between these species matters because each one thrives under different conditions and plays a different role in the food web. Prochlorococcus favors warm, nutrient-poor water, while Synechococcus and picoeukaryotes prefer the cooler, nutrient-richer conditions typical of coastal water and upwelling. By resolving which species is present, PACE reveals shifts in ocean ecosystems that a simple measurement of total chlorophyll would miss. PACE was launched in February 2024.

Major Findings

Figure 1 captures something scientists have never been able to see before: the same frontal eddies in the Gulf Stream viewed through the lens of three different instruments within a single six-hour window. SWOT mapped the shape of the sea surface and how fast and where the water is swirling; PACE mapped which phytoplankton species were thriving in and around the eddies; and NISAR independently confirmed where the eddies’ rough-water edges were, at a resolution of 40 meters. 

For context, the figure also includes the coarser gridded sea surface height product MIOST (Multiscale Interpolation Ocean Science Topography), which shows the broader Gulf Stream sea surface height field in the Atlantic Ocean surrounding the individual SWOT pass (Figure 1b).

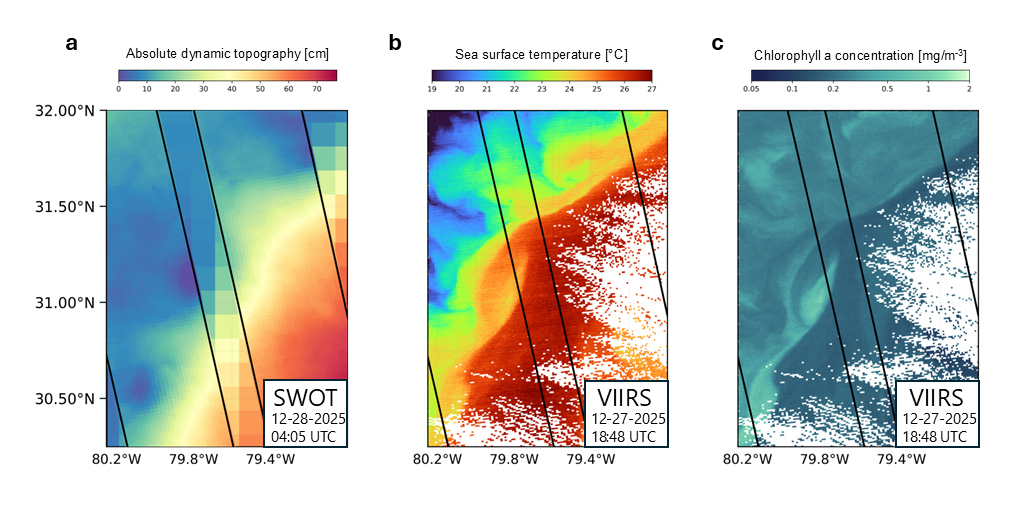
Frontal eddies pull cold water up from below and mix it with warmer surface water near the coast, creating a characteristic ‘shingle’ pattern in the sea surface temperature (SST) field. A fourth satellite, Suomi-NPP VIIRS, captured the eddies’ SST signatures, shown in Figure 2. That temperature pattern lines up closely with where PACE detected the phytoplankton, and both variables (temperature and phytoplankton) trace the same three water masses: cold water hugging the coast, cool water inside the eddy cores, and the warm Gulf Stream jet running past them. In other words, the cold water the eddies stir up is the same water where some phytoplankton species are thriving, and scientists can now see both processes happening together.

Image
Image Caption

Figure 2: A closer look at the same eddies off the southeastern United States (30–32°N), comparing SWOT and VIIRS data taken 10 hours apart. (a) SWOT sea surface height map. (b) VIIRS sea surface temperature. (c) VIIRS chlorophyll-a. 

NASA’s new Earth-observing satellites have given us the ability to observe, for the first time, submesoscale eddies in multiple oceanic variables at once. As these satellites collect data systematically, and in most cases globally, for years to come, we'll be able to track seasonal and even year-to-year changes. We can begin to answer scientific questions about submesoscale eddies that have eluded us until now – about their generation and decay, their global and seasonal distributions, and their impact upon ocean ecosystems. 

The wealth of new data collected will also serve to validate high-resolution numerical models and improve the existing parameterizations of climate models that are not yet able to resolve such small features. These models allow us to better understand our planet and provide forecasting capabilities.

Related Resources

References

  • Mahadevan, A. (2016). The Impact of Submesoscale Physics on Primary Productivity of Plankton. Annual Review of Marine Science, 8, 161–184. doi:10.1146/annurev-marine-010814-015912
  • Gronniger, J , et al. (2023). A Gulf Stream frontal eddy harbors a distinct microbiome compared to adjacent waters. PloS one, 18(11), e0293334. doi:10.1371/journal.pone.0293334
  • Archer, M., et al. (2025). Wide-swath satellite altimetry unveils global submesoscale ocean dynamics. Nature. doi:10.1038/s41586-025-08722-8
  • Johannessen, J. A., Kudryavtsev, V., Akimov, D., et al. (2005). On radar imaging of current features: 2. Mesoscale eddy and current front detection. Journal of Geophysical Research: Oceans, 110, C07017. doi:10.1029/2004JC002802
  • Werdell, P. J., Behrenfeld, M. J., Bontempi, P. S., et al. (2019). The Plankton, Aerosol, Cloud, ocean Ecosystem (PACE) Mission: Status, Science, Advances. Bulletin of the American Meteorological Society, 100(9), 1775–1794. doi:10.1175/BAMS-D-18-0056.1
  • Suthers, I. M., Schaeffer, A., Archer, M., & Everett, J. D. (2023). Frontal eddies provide an oceanographic triad for favorable larval fish habitat. Limnology and Oceanography. doi:10.1002/lno.12326

Details

Last Updated

Sept. 14, 2026

Published

Sept. 14, 2026

Data Center/Project

Physical Oceanography DAAC (PO.DAAC)