Science Objectives
Surveys of population trends have documented declines in bird populations over several decades. However, the development of strategies to recover populations requires detailed spatial information about population change to identify where populations are most imperiled and the optimal locations to focus conservation efforts.
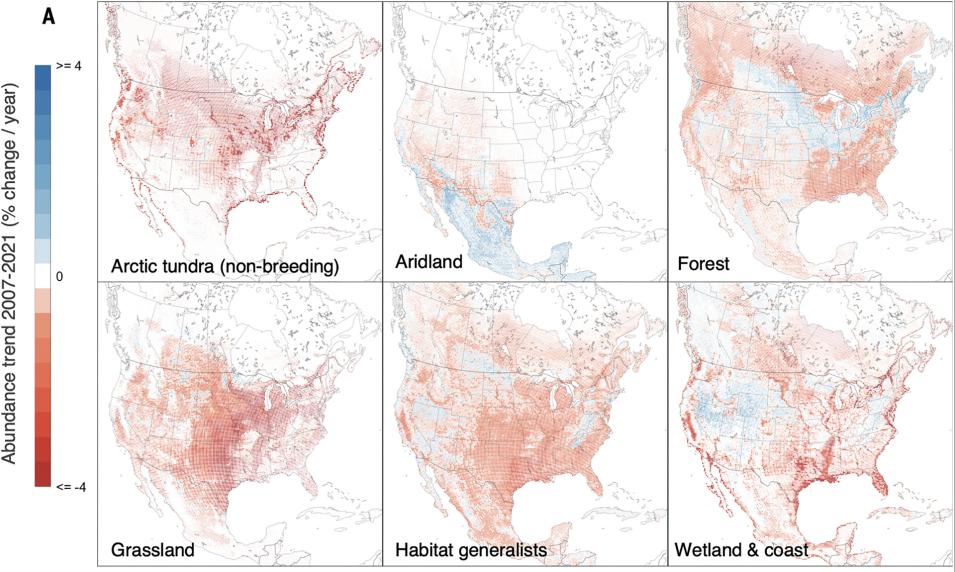
To get that information, the authors of “North American Bird Declines Are Greatest Where Species Are Most Abundant,” a paper published in the journal Science in May 2025, gathered participatory science (also called citizen science) data to reveal high-resolution patterns of avian population change across North America.
These high-resolution data offer significant advantages for conservation efforts, as they can help researchers detect localized declines obscured at coarser resolutions, identify the causes of declines, and inform management, which is typically implemented within local landscapes. Access to high-resolution data is especially valuable when resources for conservation are limited, as decision-makers can use them to prioritize actions among locations to get the best return on investment.
Data and Techniques Used
To conduct their study, the researchers used 36 million checklists—lists of the birds observed and identified by a participant at a particular time and place—from eBird collected from 2007 to 2021 to estimate population trends for 495 bird species breeding within North America, Central America, and the Caribbean.
Each checklist was also linked to a series of covariates derived from MODIS data archived at NASA’s Land Processes Distributed Active Archive Center (LP DAAC). In particular, the researchers used the following datasets:
- MODIS Land Cover Type Yearly Level 3 Global 500-meter SIN Grid Version 061 (MCD12Q1) dataset, which was selected for its moderately high spatial resolution and annual temporal resolution, to capture spatial patterns of change in land cover, land use, and hydrology. Checklists were linked to the MODIS data by year from 2001 to 2020, capturing inter-annual changes in land cover. The checklist data for 2021 were matched to the 2020 data, as MODIS data from after 2020 were unavailable at the time of analysis.
- MODIS/Terra Land Water Mask Derived from MODIS and Shuttle Radar Topography Mission (SRTM) Level 3 Global 250-meter SIN Grid Version 061 (MOD44W) dataset, which was applied to help delineate the interface between terrestrial, aquatic, and marine environments.
In addition, although not mentioned in the paper published in Science, the eBird website notes that each checklist location was matched to the environmental data (i.e., elevation, bathymetry, and bathymetric slope) from the 30-meter resolution ASTER Global Digital Elevation Model (ASTGTM) within a 1.5 km radius. The Aster Global Water Bodies Dataset (ASTWBD) was also used to describe water cover from 2000 to 2013 at 30-meter resolution. These data are also available from LP DAAC.
Because eBird does not have the structured protocols necessary to maintain consistent sampling across space and time, the researchers applied a causal machine learning trend model designed to control for confounding sources of intra- and interannual variation, including changes in site selection, search effort, and search efficiency.
To assess the reliability of the trend estimates, the researchers used a suite of spatially explicit simulations for each species to assess statistical power and error rates. With these simulations, the researchers were able to reliably detect and delineate spatial variation with low error rates for trends at 27-kilometer spatial resolution for most North American species.
Major Findings
The results of this study revealed high and previously undetected spatial heterogeneity in bird population change and relative abundance trends; although 75% of species were declining, 97% of species showed separate areas of significantly increasing and decreasing populations. The researchers found that bird populations tended to decline most steeply in strongholds where species were most abundant, yet they fared better where species were least abundant.
Further, this study demonstrates how participatory science data combined with other broad-scale, observational datasets, such as those from Earth-observing satellites, can be leveraged with promising analytical tools to detect, diagnose, and respond to population changes at ecologically relevant scales. The ability to estimate population trends for hundreds of species at landscape scales and across an entire continent can advance the ability of scientists, managers, and decision-makers seeking to understand and reverse population declines.
High-resolution trends, in conjunction with other environmental datasets, can also be used to study the associations with other spatially dependent processes (e.g., management actions, resource availability, or change) and provide new insights to better understand the drivers of population change.
References
Publication Reference
Johnston, A., et al. (2025). North American bird declines are greatest where species are most abundant. Science 388(6746), 532-537. doi:10.1126/science.adn4381
