We are in the process of migrating all NASA Earth science data sites into Earthdata from now until end of 2026. Not all NASA Earth science data and resources will appear here until then. Thank you for your patience as we make this transition.
Read about the Web Unification Project
Natural Hazards Data Access and Tools
From discovery to visualization, data tools such as the SEDAC Hazards Mapper and NASA's Flooding Days Projection Tool guide users in making the most of natural hazards data.
Natural Hazards Datasets
| Dataset Sort descending | Version | Platforms | Instruments | Temporal Extent | Spatial Extent | Spatial Resolution | Data Format |
|---|---|---|---|---|---|---|---|
| Global Summer Land Surface Temperature (LST) Grids, 2013 | 1.0 | MODELS | Computer | 2013-01-01 to 2013-12-31 |
N: 80.01 S: -60.01 E: 179.99 W: -180 |
0.008365 Decimal Degrees x 0.008365 Decimal Degrees | GeoTIFF, PDF, PNG, WMS |
| Global Urban Heat Island (UHI) Data Set, 2013 | 1.0 | MODELS | Computer | 2013-01-01 to 2013-12-31 |
N: 78.28 S: -54.86 E: 179.46 W: -176.2 |
Excel, Shapefile, PDF, PNG, WMS | |
| Global Volcano Hazard Frequency and Distribution | 1.0 | MODELS | Computer | 1979-01-01 to 2000-12-31 |
N: 85 S: -58 E: 180 W: -180 |
0.0417 Decimal Degrees x 0.0417 Decimal Degrees | ASCII, PDF, PNG, WMS |
| Global Volcano Mortality Risks and Distribution | 1.0 | MODELS | Computer | 2000-01-01 to 2000-12-31 |
N: 85 S: -58 E: 180 W: -180 |
0.0417 Decimal Degrees x 0.0417 Decimal Degrees | ASCII, DBF, PDF, PNG, WMS |
| Global Volcano Proportional Economic Loss Risk Deciles | 1.0 | MODELS | Computer | 2000-01-01 to 2000-12-31 |
N: 86 S: -58 E: 180 W: -180 |
0.0417 Decimal Degrees x 0.0417 Decimal Degrees | ASCII, PDF, PNG, WMS |
| Global Volcano Total Economic Loss Risk Deciles | 1.0 | MODELS | Computer | 2000-01-01 to 2000-12-31 |
N: 86 S: -58 E: 180 W: -180 |
0.0417 Decimal Degrees x 0.0417 Decimal Degrees | ASCII, DBF, PDF, PNG, WMS |
| GPM Ground Validation Global Flood Monitoring System (GFMS) Flood Maps IFloodS V1 | 1 | DMSP, Aqua, TRMM, NOAA POES | SSM/I, SSMIS, AMSR-E, TMI, AMSU-B | 2013-03-26 to 2013-06-30 |
N: 49.875 S: -49.875 E: 179.875 W: -179.875 |
netCDF-4 - ASCII | |
| GRIP Hurricane and Tropical Storm Forecasts V1 | 1 | MODELS | Computer | 2010-08-12 to 2010-11-14 |
N: 87.6 S: 0.8 E: 0 W: -178.5 |
ASCII | |
| HURRICANE AND SEVERE STORM SENTINEL (HS3) GLOBAL HAWK NAVIGATION V1 | 1 | GLOBAL HAWK | GPS, INS | 2012-09-06 to 2014-09-30 |
N: 51.5268 S: 7.55657 E: -19.4239 W: -174.843 |
ASCII - XML | |
| HURRICANE AND SEVERE STORM SENTINEL (HS3) WORLD WIDE LIGHTNING LOCATION NETWORK (WWLLN) STORMS V1 | 1 | WWLLN | GPS, RF ANTENNA, VLF RECEIVERS | 2012-08-28 to 2014-10-20 |
N: 68.994 S: 12.9 E: -15.001 W: -116.595 |
netCDF-4 - ASCII |
SHOWING 10 OF 132
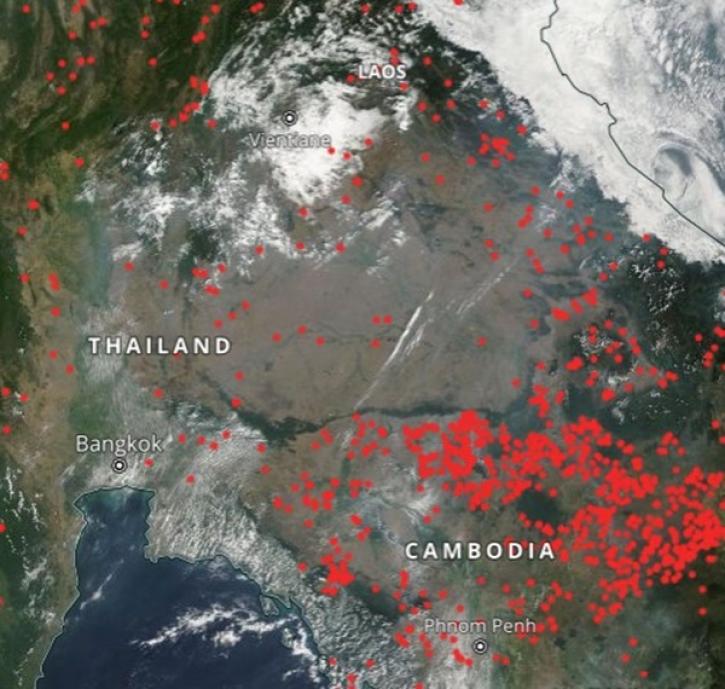
Featured Observation Method: VIIRS
NASA's Visible Infrared Imaging Radiometer Suite (VIIRS) provides active data for fire management and wildfire alert systems.

Learn how to use NASA's Fire Information for Resource Management System (FIRMS) and its enhanced User Interface that provides additional services and analysis capabilities for wildfire management.
Geographer Veerachai Tanpipat promotes the use of NASA's Fire Information for Resource Management System (FIRMS) throughout the Lower Mekong River Region.
9 MIN READ

NASA’s worldwide Fire Information for Resource Management System (FIRMS) provides vital near real-time tools for managing wildland fires.
7 MIN READ
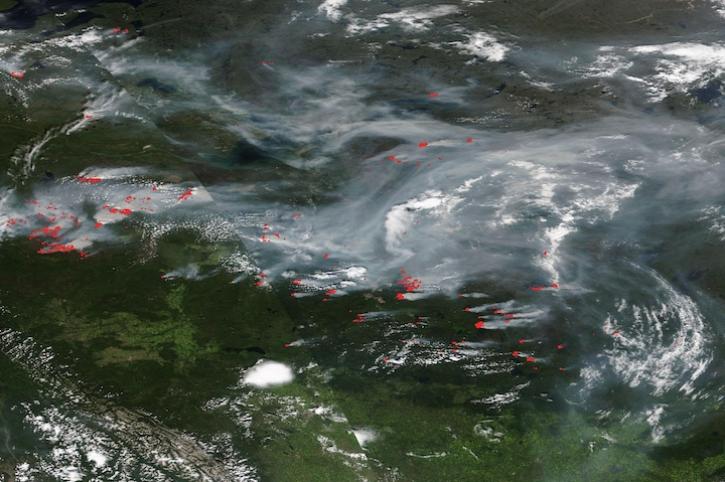
Image captured on July 17, 2024, by the VIIRS instrument aboard the joint NASA/NOAA NOAA-20 satellite.
Natural Hazards Data Tools
| Tool Sort descending | Description | Services | |
|---|---|---|---|
| AppEEARS | The The Application for Extracting and Exploring Analysis Ready Samples (AppEEARS) offers users a simple and efficient way to perform data access and transformation processes. | Search and Discovery, Subsetting, Customization, Downloading, Visualization | |
| EONET | Use NASA Earth Observatory's Natural Event Tracker to look for natural events as they occur all across the planet. | Access, Data Curation, Monitoring Natural Events | |
| FIRMS | The Fire Information for Resource Management System (FIRMS) provides access to satellite imagery, active fire/hotspots, and related products to identify the location, extent, and intensity of wildfire activity. | Access, Visualization | |
| FLOOD | The FLOOD viewer facilitates the use and evaluation of LANCE flood products by allowing the user to browse globally and over time, and to compare to other flood products. | Monitoring Natural Events, Search and Discovery, Visualization | |
| Giovanni | Giovanni is a web application for accessing, visualizing, and analyzing Earth science remote sensing data without downloading the data. | Search and Discovery, Analysis, Access, Visualization, Downloading, Subsetting | |
| GUARDIAN | The GNSS-based Upper Atmospheric Realtime Disaster Information and Alert Network (GUARDIAN) is a near real-time (NRT) ionospheric monitoring tool for natural hazards warning. | Monitoring Natural Events | |
| Hazards Mapper | The Hazards Mapper enables users to rapidly get an idea of the population, land area, dams, and nuclear power plants that could be impacted by a wide range of natural events, including floods, earthquakes, fires, and volcanic eruptions. | Analysis, Search and Discovery, Visualization | |
| Hurricane Intensity Estimator | NASA's Hurricane Intensity Estimator is an online platform that demonstrates the use of a machine learning model for estimating the wind speed of hurricanes. | Visualization, Monitoring Natural Events | |
| NYS FIDSS Mapper | The New York State Flood Information Decision Support System Mapper is an easy-to-use mapping tool visualizes building footprint data for nearly all New York State’s infrastructure, except New York City. | Visualization | |
| OpenAltimetry | OpenAltimetry is a map-based visualization tool for exploring surface elevation data across Earth over time. | Analysis, Search and Discovery, Visualization |
SHOWING 10 OF 15
Frequently Asked Questions
Earthdata Forum
Our online forum provides a space for users to browse thousands of FAQs about research needs, data, and data applications. You can also submit new questions for our experts to answer.
Submit Questions to Earthdata Forumand View Expert Responses