We are in the process of migrating all NASA Earth science data sites into Earthdata from now until end of 2026. Not all NASA Earth science data and resources will appear here until then. Thank you for your patience as we make this transition.
Read about the Web Unification Project
Trace Gases/Trace Species Data Access and Tools
NASA has trace gases/trace species datasets that help researchers characterize the makeup of the atmosphere. Access a range of data and data tools such as AppEEARS, FIRMS, and Giovanni to make the most of trace gases/trace species data.
Many NASA observation methods—platforms, instruments, and space geodesy techniques—provide data that improve our understanding of trace gases, including NASA's Tropospheric Emissions: Monitoring Pollution (TEMPO) instrument, featured below.
Trace Gases/Trace Species Datasets
| Dataset Sort descending | Version | Platforms | Instruments | Temporal Extent | Spatial Extent | Spatial Resolution | Data Format |
|---|---|---|---|---|---|---|---|
| PEM West B Ground Data | 1 | GROUND STATIONS | NDIR GAS ANALYZER, GAS CHROMATOGRAPHS, CHEMILUMINESCENCE, RAWINSONDES, OZONESONDES, GC-ECD, ION CHROMATOGRAPHS | 1991-02-22 to 1995-01-01 |
N: 52.92 S: 21.33 E: 180 W: -180 |
GTE | |
| PEM West B Merge Data | 1 | Data Analysis, NASA DC-8 | 1994-01-26 to 1994-03-15 |
N: 90 S: -9.7 E: 180 W: -180 |
GTE | ||
| PEM West B Model Data | 1 | Data Analysis | 1994-01-02 to 1994-03-15 |
N: 52 S: -10 E: 180 W: -180 |
GTE | ||
| Pre-LBA ABLE-2A and ABLE-2B Expedition Data | 1 | GROUND STATIONS, BALLOONS, METEOROLOGICAL STATIONS | LIDAR, RADIOMETERS, OZONESONDES, THERMOMETERS | 1985-07-11 to 1987-05-13 |
N: 0 S: -10 E: -50 W: -70 |
Shapefile | |
| Pre-LBA TRACE-A Data | 1 | NASA DC-8, Nimbus-7, BALLOONS | GAS CHROMATOGRAPHS, SPECTRORADIOMETERS, TOMS, OZONESONDES, OZONE SENSOR | 1992-08-18 to 1992-10-26 |
N: -4 S: -40 E: 40 W: -125 |
Shapefile | |
| SAFARI 2000 1-Degree Estimates of Burned Biomass, Area, and Emissions, 2000 | 1 | MODELS, SPOT-4, ERS-2, Terra | Computer, MULTI-SPECTRAL, ATSR, MODIS | 2000-08-01 to 2000-09-30 |
N: 0 S: -36 E: 56 W: -18 |
Shapefile | |
| SAFARI 2000 Biomass Burning Emissions, Selected Sites, Dry Season 2000 | 1 | LABORATORY | CHEMILUMINESCENCE, ION CHROMATOGRAPHS, GAS CHROMATOGRAPHS, IR CO2 ANALYZER | 2000-11-24 to 2001-01-16 |
N: 0 S: -35 E: 50 W: 10 |
Shapefile | |
| SAFARI 2000 C-130 Aerosol and Meteorological Data, Dry Season 2000 | 1 | C-130 | GC-MS, MR, AERI, MMR, PMS 2D-P PROBE, PMS 2D-C PROBE, DEWPOINT HYDROMETERS, HYGROMETERS, CLOUD LIQUID WATER PROBE, CNC, FLUOROMETERS, INFRARED RADIOMETERS, FSSP, CVI, PHOTOMETERS, SPECTROMETERS, MASS SPECTROMETERS | 2000-09-05 to 2000-09-16 |
N: 5 S: -35 E: 60 W: 5 |
Shapefile | |
| SAFARI 2000 Emissions Estimates, MODIS Burned Area Product, Dry Season 2000 | 1 | Terra | MODIS | 2000-08-31 to 2000-09-30 |
N: 0.3389 S: -34.1425 E: 46.6473 W: 9.6738 |
Shapefile | |
| SAFARI 2000 Fire Emission Data, Dry Season 2000 | 1 | CONVAIR CV-580 | FOURIER TRANSFORM SPECTROMETERS | 2000-08-14 to 2000-09-14 |
N: -14 S: -27 E: 36 W: 12 |
CSV |
SHOWING 10 OF 181
Featured Trace Gases/Trace Species Observation Method: TEMPO
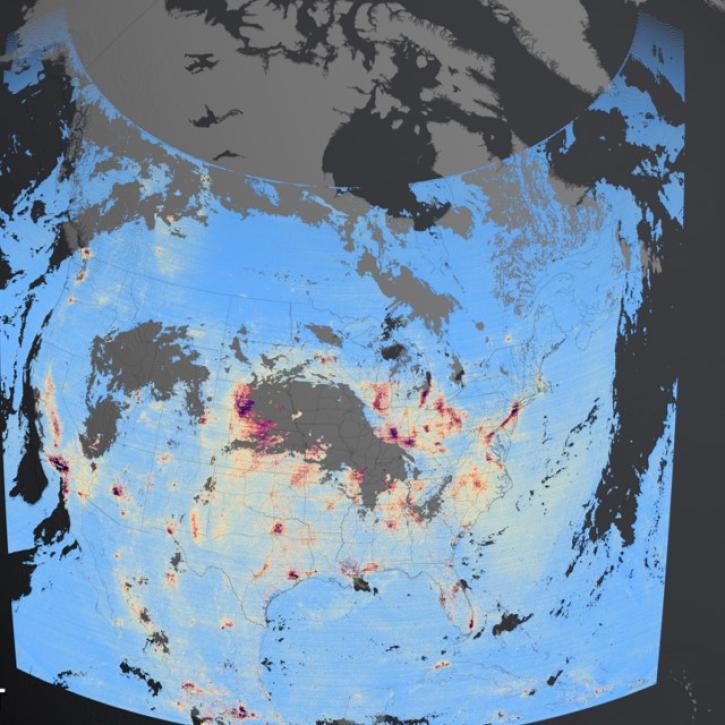
The Tropospheric Emissions: Monitoring Pollution (TEMPO) instrument is a high-resolution, visible and ultraviolet light spectrometer aboard the Intelsat 40e platform. TEMPO monitors major air pollutants, such as ozone and nitrogen dioxide, across North America every daylight hour.
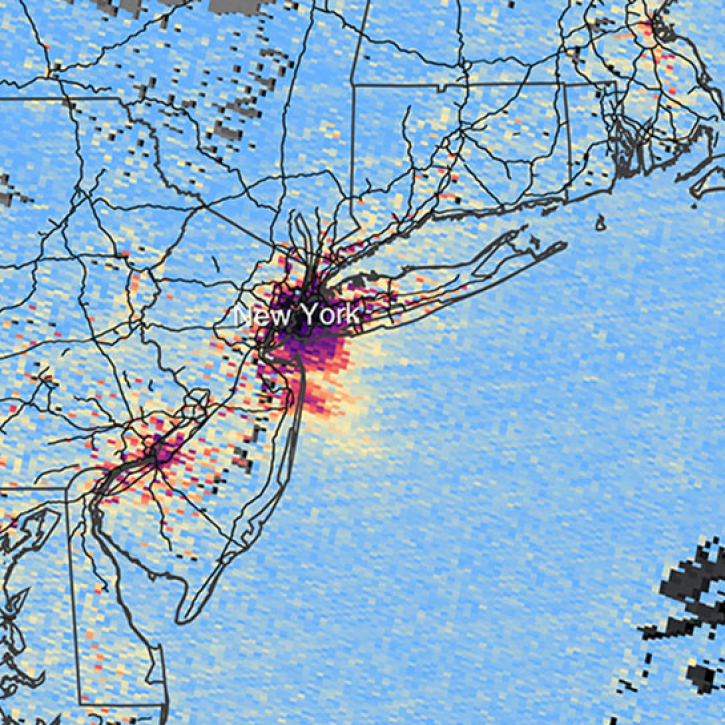
Videos from NASA’s Scientific Visualization Studio reveal the brilliant view from the agency’s newest pollution-detecting sensor.
6 MIN READ
This Satellite Needs Working Group solution aims to provide an hourly sulfur dioxide (SO2) concentration product and additional trace gas measurements from the Tropospheric Emissions: Monitoring Pollution (TEMPO) mission.
This webinar provides an overview of the TEMPO mission and its data products and shows how to discover and access TEMPO data products using NASA's Earthdata Search.
This Satellite Needs Working Group solution aims to provide hourly near real-time (NRT) air quality products using Tropospheric Emissions: Monitoring Pollution (TEMPO) and Geostationary Operational Environmental Satellite (GOES) data.
Frequently Asked Questions
Earthdata Forum
Our online forum provides a space for users to browse thousands of FAQs about research needs, data, and data applications. You can also submit new questions for our experts to answer.
Submit Questions to Earthdata Forumand View Expert Responses