We are in the process of migrating all NASA Earth science data sites into Earthdata from now until end of 2026. Not all NASA Earth science data and resources will appear here until then. Thank you for your patience as we make this transition.
Read about the Web Unification Project
Nitrogen Dioxide Data Access and Tools
Access topic-specific data and resources for accessing, visualizing, preparing/manipulating (e.g. subsetting), and analyzing data. Each observation, model, and reanalysis data has unique characteristics that should be considered when evaluating its use.
An asterisk (*) next to an entry indicates that near real-time (NRT) data products are available through NASA's Land, Atmosphere Near real-time Capability for Earth observation (LANCE). While not intended for scientific research, NRT data are good resources for monitoring ongoing or time-critical events. Learn more about the difference between near real-time versus standard products.
Commonly Used Nitrogen Dioxide Data at a Glance
| Spatial Resolution | Spatial Coverage | Temporal Resolution | Temporal Coverage | Spectral Resolution | Satellite/ Platform | Name (Instrument, Model, etc.) | Observation, Model, or Reanalysis | File Format |
|---|---|---|---|---|---|---|---|---|
| 0.25°, 13 km x 24 km | Global | 98 min, Daily | 2004-near present | 1.0-0.45 nm Full Width and Half Maximum (FWHM) | Aura | Ozone Monitoring Instrument (OMI) | Observation | HDF-EOS5 |
| 5.5 km x 3.5 km | Global | 101.5 minutes | 2021-present | 270 nm-2.3 µm, 0.55 nm | ESA Sentinel-5P | TROPOspheric Monitoring Instrument (TROPOMI) | Observation | netCDF |
| 2.0 km x 4.75 km | North America | Hourly | 08/2023 - present | 0.6 nm | Intelsat 40e | Tropospheric Emissions: Monitoring Pollution (TEMPO) | Observation | netCDF |
| 0.25º x 0.25° | Global | 15 min, Hourly | Daily 5-day forecast | N/A | N/A | GEOS-CF | Model | netCDF |
| 0.0083° x 0.0083° | Near-global | Yearly | 1990-2020 | N/A | N/A | LUR | Model | netCDF |
| Point measurements | Global | Periodic flights occurred during each deployment | 2016-2018 | Varies | Airborne Field Campaign | Atmospheric Tomography Mission (ATom) campaign with varying instruments | Observation | netCDF |
Nitrogen Dioxide Datasets
| Dataset Sort descending | Version | Platforms | Instruments | Temporal Extent | Spatial Extent | Spatial Resolution | Data Format |
|---|---|---|---|---|---|---|---|
| ABLE-3A Electra In-Situ Trace Gas Data | 1 | NASA ELECTRA | GAS CHROMATOGRAPHS, GRAB SAMPLERS, LIF-NO | 1988-07-07 to 1988-08-18 |
N: 83.332 S: 37.082 E: -55.443 W: -168.402 |
GTE | |
| ABLE-3A Ground Data | 1 | GROUND-BASED OBSERVATIONS | Harvard CO2 | 1988-07-07 to 1988-08-18 |
N: 83.332 S: 37.082 E: -55.443 W: -168.402 |
GTE | |
| ACCLIP WB-57 Aircraft In-situ Trace Gas Data | 1 | NASA WB-57F | ACOS, COMA, LIF-NO, LIF-SO2, ISAF, COLD 2, UASO3 | 2022-07-14 to 2022-09-14 | ICARTT | ||
| ACCLIP WB-57 Aircraft Merge Data | 1 | NASA WB-57F | Computer | 2022-07-16 to 2022-09-14 |
N: 61.5 S: 16.6 E: 180 W: -180 |
ICARTT | |
| ARCTAS DC-8 Aircraft In-situ Photolysis Rate Data | 1 | NASA DC-8 | CAFS | 2008-03-17 to 2008-07-14 | ICARTT | ||
| ARCTAS DC-8 Aircraft In-situ Trace Gas Data | 1 | NASA DC-8 | TOGA, GAS CHROMATOGRAPHS, ATHOS, HOxCIMS, TD-LIF, DACOM, DIAL, CIMS, FLUORESCENCE SPECTROSCOPY, NDIR GAS ANALYZER, NOxyO3, PTR-MS | 2008-03-18 to 2008-07-14 | ICARTT | ||
| ARCTAS Model Data | 1 | CLIMATE MODELS, GEOS-5, GEOS-Chem | Computer | 2008-03-30 to 2008-07-14 | netCDF-3, ICARTT | ||
| ARCTAS P-3B Aircraft AATS14 Data | 1 | P-3B | AATS14 | 2008-03-25 to 2008-07-13 | ICARTT | ||
| ARISE 2014 C-130 Remotely Sensed Aerosol and Trace Gas Data | 1 | C-130 | 4STAR | 2014-08-30 to 2014-10-05 | ICARTT | ||
| ARISE C-130 Aircraft Merge Data Files | 1 | C-130 | Computer | 2014-08-30 to 2014-10-06 | ICARTT |
SHOWING 10 OF 213
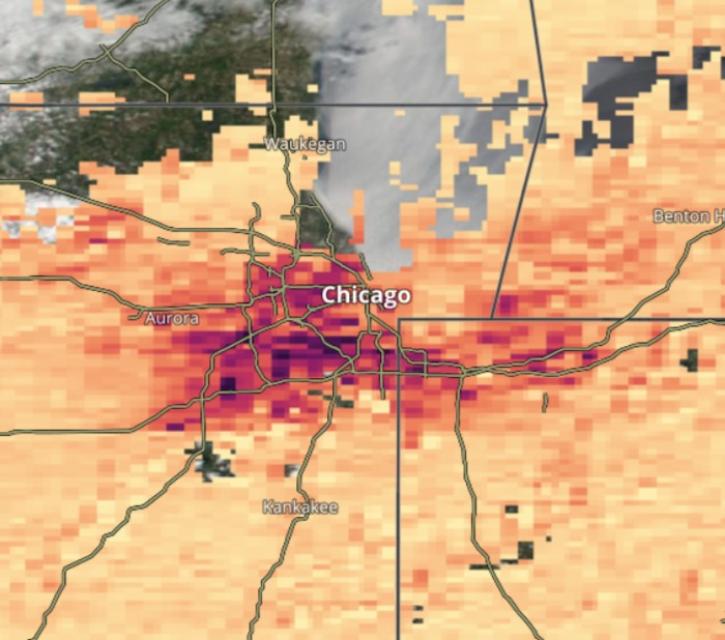
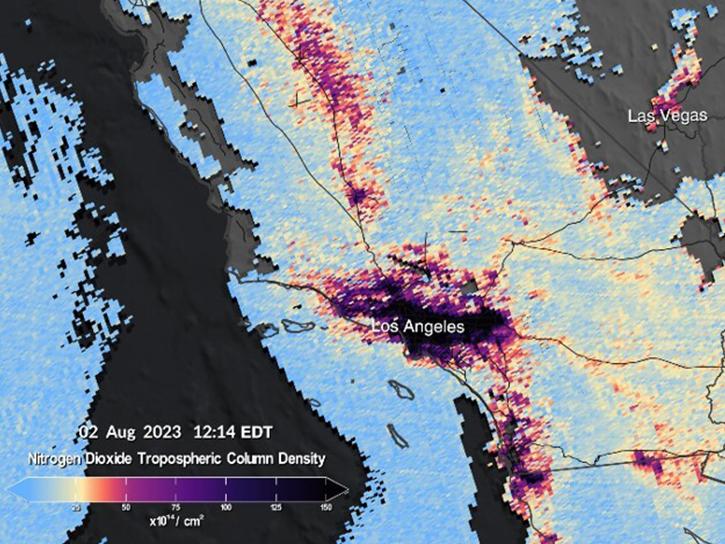
Featured Nitrogen Dioxide Observation Method: TEMPO
The Tropospheric Emissions: Monitoring Pollution (TEMPO) instrument is a grating spectrometer sensitive to visible and ultraviolet wavelengths of light. It monitors major air pollutants such as ozone and nitrogen dioxide across the North American continent every daylight hour at high spatial resolution.
This Satellite Needs Working Group solution aims to provide hourly near real-time (NRT) air quality products using Tropospheric Emissions: Monitoring Pollution (TEMPO) and Geostationary Operational Environmental Satellite (GOES) data.
The 14 layers from the Tropospheric Emissions: Monitoring of Pollution mission offer data on clouds, nitrogen dioxide, ozone, and more.
More than a dozen Level 1, 2, and 3 data products from NASA's Tropospheric Emissions: Monitoring of Pollution (TEMPO) Version 03 collection are now available at provisional maturity.

Image captured on Dec 10, 2024, by the TEMPO instrument aboard the Intesat-40e platform.
Frequently Asked Questions
Earthdata Forum
Our online forum provides a space for users to browse thousands of FAQs about research needs, data, and data applications. You can also submit new questions for our experts to answer.
Submit Questions to Earthdata Forumand View Expert Responses