Air Quality Data Access and Tools

NASA has air quality datasets that help researchers characterize the particular makeup of the air we breathe. Access a range of data and data tools such as AppEEARS, FIRMS, and Giovanni to make the most of air quality data.

Air quality comprises a constellation of scientific topics that inform our understanding of this field. Learn more about data and resources focused on aerosol optical depth, aerosol index, trace gases, land surface reflectance, the effect of dust, ash, and smoke, and human dimensions, including natural hazards.

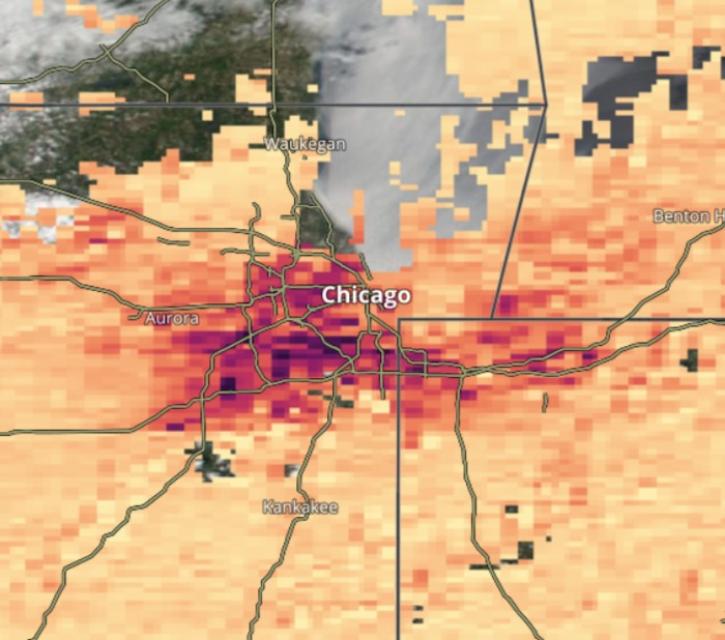
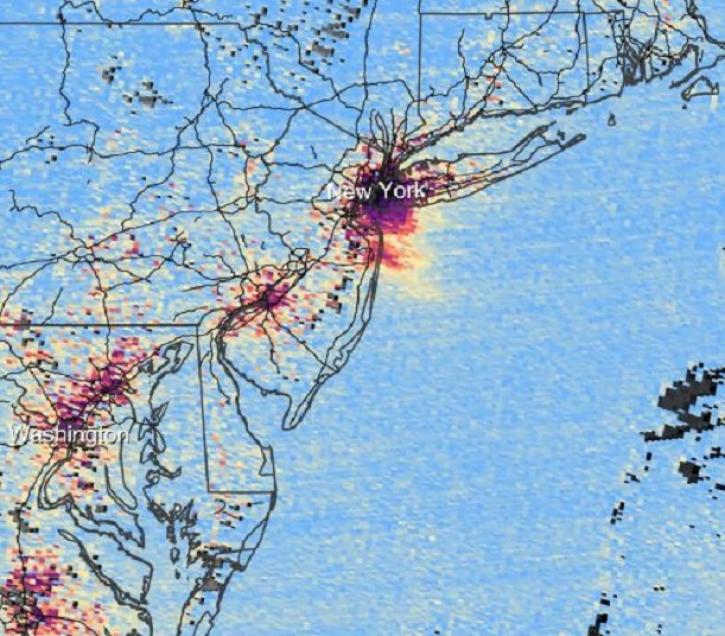
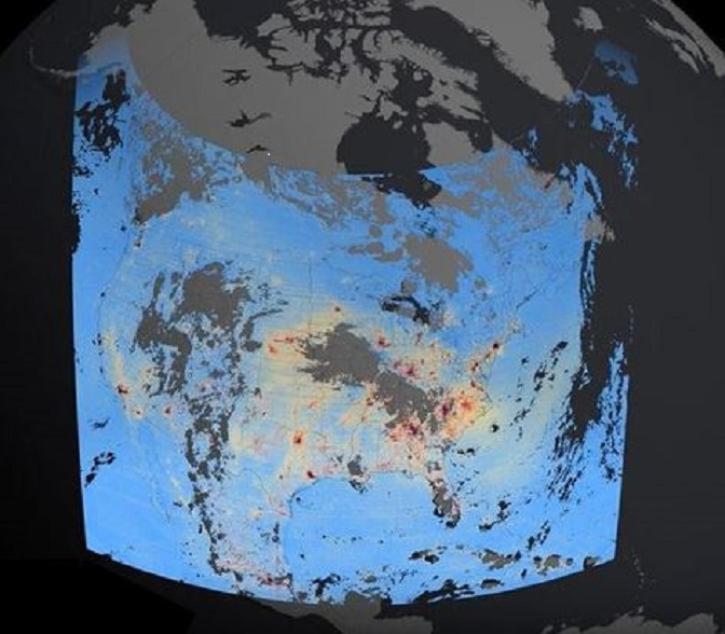
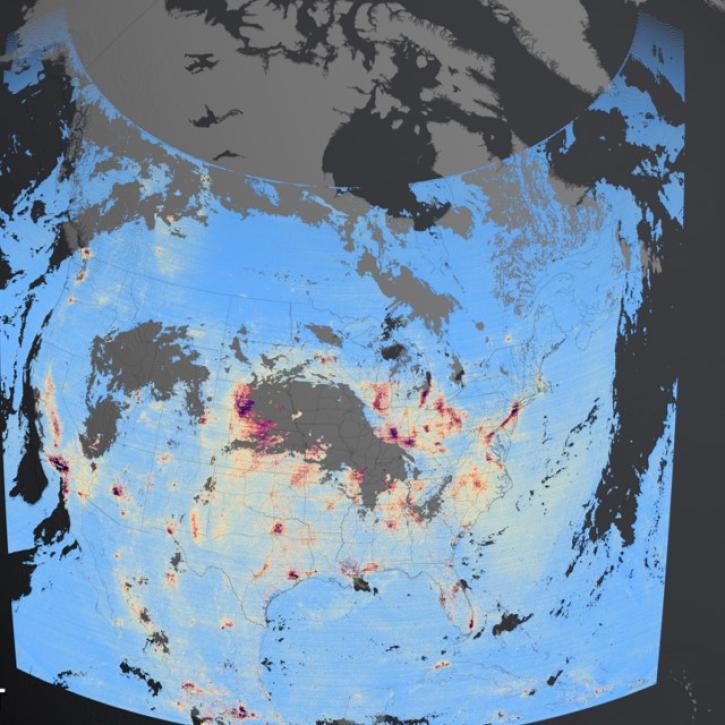
Many NASA observation methods—platforms, instruments, and space geodesy techniques—provide data that improve our understanding of air quality, including NASA's Tropospheric Emissions: Monitoring Pollution (TEMPO) instrument, featured below. Learn more about how the Advanced Spaceborne Thermal Emission and Reflection Radiometer (ASTER), Harmonized Landsat Sentinel-2 (HLS), Moderate Resolution Imaging Spectroradiometer (MODIS), and Visible Infrared Imaging Radiometer Suite (VIIRS) continually acquire data about pollutants.
Air Quality Datasets

Filters
Dataset Sort descending Version Platform Instrument Temporal Extent Spatial Extent Spatial Resolution Data Format
MISR Level 3 Component Global Albedo product in netCDF format covering a day V006 006 Terra MISR 1999-12-18 to Present

N: 90 S: -90 E: 180 W: -180

netCDF-4
MISR Level 3 Component Global Albedo product in netCDF format covering a year V006 006 Terra MISR 1999-12-01 to Present

N: 90 S: -90 E: 180 W: -180

netCDF-4
MISR Level 3 Component Global Albedo seasonal product in netCDF format V006 006 Terra MISR 1999-12-18 to Present

N: 90 S: -90 E: 180 W: -180

netCDF-4
MISR Level 3 FIRSTLOOK Component Global Aerosol Product covering a day V002 002 Terra MISR 1999-12-18 to 2017-11-30

N: 90 S: -90 E: 180 W: -180

0.5 Decimal Degrees x 0.5 Decimal Degrees HDF-EOS2
MISR Level 3 FIRSTLOOK Component Global Aerosol Product covering a month V002 002 Terra MISR 1999-12-18 to 2017-10-31

N: 90 S: -90 E: 180 W: -180

0.5 Decimal Degrees x 0.5 Decimal Degrees HDF-EOS2
MISR Level 3 FIRSTLOOK Component Global Albedo product covering a day V002 002 Terra MISR 1999-12-18 to Present

N: 90 S: -90 E: 180 W: -180

HDF-EOS2
MISR Level 3 FIRSTLOOK Component Global Albedo product covering a month V002 002 Terra MISR 1999-12-18 to Present

N: 90 S: -90 E: 180 W: -180

HDF-EOS2
MISR Level 3 FIRSTLOOK Global Aerosol product in netCDF format covering a day V002 002 Terra MISR 1999-12-18 to Present

N: 90 S: -90 E: 180 W: -180

netCDF-4
MISR Level 3 FIRSTLOOK Global Aerosol product in netCDF format covering a month V002 002 Terra MISR 1999-12-18 to Present

N: 90 S: -90 E: 180 W: -180

netCDF-4
MISR Level 3 FIRSTLOOK Global Albedo product in netCDF format covering a day V002 002 Terra MISR 1999-12-18 to Present

N: 90 S: -90 E: 180 W: -180

netCDF-4
MISR Level 3 FIRSTLOOK Global Albedo product in netCDF format covering a month V002 002 Terra MISR 1999-12-18 to Present

N: 90 S: -90 E: 180 W: -180

netCDF-4
MODIS/Aqua Temperature and Water Vapor Profiles 5-Min L2 Swath 5km - NRT 6.1NRT Aqua MODIS 2017-10-20

N: 90 S: -90 E: 180 W: -180

5 Kilometers x 5 Kilometers HDF-EOS
MOOSE Aerodyne Mobile Laboratory Measurements 1 GROUND-BASED OBSERVATIONS GC-EI-TOF, Aerodyne Mini-TILDAS, Aerodyne CAPS, LICOR GAS EXCHANGE SYSTEM, 2B Technologies 2021-05-20 to 2021-07-01

N: 43.12 S: 41.9 E: -82.42 W: -83.77

ICARTT
MOOSE NASA G-3 Aircraft GEO-CAPE Airborne Simulator (GCAS) Remotely Sensed Data 1 G-III GCAS 2021-06-05 to 2021-06-29

N: 43.62 S: 36.88 E: -72.11 W: -85.32

NetCDF-4
MOPITT Beta CO gridded daily means (Near and Thermal Infrared Radiances) V109 109 Terra MOPITT 2018-03-25 to 2025-02-01

N: 90 S: -90 E: 180 W: -180

HDF-EOS5
MOPITT Beta CO gridded daily means (Near Infrared Radiances) V109 109 Terra MOPITT 2018-03-25 to 2025-02-01

N: 90 S: -90 E: 180 W: -180

HDF-EOS5
MOPITT Beta CO gridded daily means (Thermal Infrared Radiances) V109 109 Terra MOPITT 2018-03-25 to 2025-02-01

N: 90 S: -90 E: 180 W: -180

HDF-EOS5
MOPITT Beta CO gridded monthly means (Near and Thermal Infrared Radiances) V109 109 Terra MOPITT 2018-03-01 to 2025-02-01

N: 90 S: -90 E: 180 W: -180

HDF-EOS5
MOPITT Beta CO gridded monthly means (Near Infrared Radiances) V109 109 Terra MOPITT 2018-03-01 to 2025-02-01

N: 90 S: -90 E: 180 W: -180

HDF-EOS5
MOPITT Beta CO gridded monthly means (Thermal Infrared Radiances) V109 109 Terra MOPITT 2018-03-01 to 2025-02-01

N: 90 S: -90 E: 180 W: -180

HDF-EOS5
MOPITT CO gridded daily means (Near and Thermal Infrared Radiances) V009 9 Terra MOPITT 2000-03-03 to 2025-02-01

N: 90 S: -90 E: 180 W: -180

HDF-EOS5
MOPITT CO gridded daily means (Near and Thermal Infrared Radiances) V010 10 Terra MOPITT 2000-03-03 to 2025-02-01

N: 90 S: -90 E: 180 W: -180

2 Decimal Degrees x 2.5 Decimal Degrees HDF-EOS5
MOPITT CO gridded daily means (Near Infrared Radiances) V009 9 Terra MOPITT 2000-03-03 to 2025-02-01

N: 90 S: -90 E: 180 W: -180

HDF-EOS5
MOPITT CO gridded daily means (Near Infrared Radiances) V010 10 Terra MOPITT 2000-03-03 to 2025-02-01

N: 90 S: -90 E: 180 W: -180

2 Decimal Degrees x 2.5 Decimal Degrees HDF-EOS5
MOPITT CO gridded daily means (Thermal Infrared Radiances) V009 9 Terra MOPITT 2000-03-03 to 2025-02-01

N: 90 S: -90 E: 180 W: -180

HDF-EOS5

Air Quality Data Tools

Tool Sort descending Description Services
AppEEARS The Application for Extracting and Exploring Analysis Ready Samples (AppEEARS) offers a simple and efficient way to perform data access and transformation processes. Search and Discovery, Subsetting, Customization, Downloading, Visualization
CASEI The Catalog of Archived Suborbital Earth Science Investigations (CASEI) is a comprehensive inventory of contextual information for NASA's Earth Science airborne and field campaigns. Search and Discovery, Cataloging
FIRMS The Fire Information for Resource Management System (FIRMS) provides access to satellite imagery, active fire/hotspots, and related products to identify the location, extent, and intensity of wildfire activity. Access, Visualization
Panoply Panoply is a cross-platform application that plots geo-referenced and other arrays from netCDF, HDF, GRIB, and other datasets. Visualization, Customization, Reformatting, Subsetting, Comparison
VEDA NASA's Visualization, Exploration, and Data Analysis (VEDA) project is an open-source science cyberinfrastructure for data processing, visualization, exploration, and geographic information systems (GIS) capabilities. Access, Analysis, Processing, Visualization, Geoprocessing
SHOWING 5 OF 5

Get Help

QUESTIONS & SUPPORT

Have a question?

Get help with NASA Earth science data, datasets, tools, services, and metadata on the Earthdata Forum. Experienced staff in the data user community review and answer questions.

Get help on Earthdata Forum
Earthdata
Forum