We are in the process of migrating all NASA Earth science data sites into Earthdata from now until end of 2026. Not all NASA Earth science data and resources will appear here until then. Thank you for your patience as we make this transition.
Read about the Web Unification Project
Air Quality Data Access and Tools
NASA has air quality datasets that help researchers characterize the particular makeup of the air we breathe. Access a range of data and data tools such as AppEEARS, FIRMS, and Giovanni to make the most of air quality data.
Air quality comprises a constellation of scientific topics that inform our understanding of this field. Learn more about data and resources focused on aerosol optical depth, aerosol index, trace gases, land surface reflectance, the effect of dust, ash, and smoke, and human dimensions, including natural hazards.
Many NASA observation methods—platforms, instruments, and space geodesy techniques—provide data that improve our understanding of air quality, including NASA's Tropospheric Emissions: Monitoring Pollution (TEMPO) instrument, featured below. Learn more about how the Advanced Spaceborne Thermal Emission and Reflection Radiometer (ASTER), Harmonized Landsat Sentinel-2 (HLS), Moderate Resolution Imaging Spectroradiometer (MODIS), and Visible Infrared Imaging Radiometer Suite (VIIRS) continually acquire data about pollutants.
Air Quality Datasets
| Dataset Sort descending | Version | Platforms | Instruments | Temporal Extent | Spatial Extent | Spatial Resolution | Data Format |
|---|---|---|---|---|---|---|---|
| Country-Level Population and Downscaled Projections Based on the SRES B2 Scenario, 1990-2100 | 1.0 | MODELS | Computer | 1990-01-01 to 2100-12-31 |
N: 90 S: -90 E: 180 W: -180 |
Excel | |
| Daily and Annual PM2.5 Concentrations for the Contiguous United States, 1-km Grids, v1 (2000 - 2016) | 1.0 | MODELS | Computer | 2000-01-01 to 2016-12-31 |
N: 72 S: 17 E: -65 W: -180 |
0.00833 Decimal Degrees x 0.00833 Decimal Degrees | GeoTIFF, Shapefile |
| Daily and Annual PM2.5 Concentrations for the Contiguous United States, 1-km Grids, Version 1.10 (2000-2016) | 1.10 | MODELS | Computer | 2000-01-01 to 2016-12-31 |
N: 72 S: 17 E: -65 W: -180 |
0.00833 Decimal Degrees x 0.00833 Decimal Degrees | GeoTIFF, Shapefile |
| Daily and Annual PM2.5, O3, and NO2 Concentrations at ZIP Codes for the Contiguous U.S., 2000-2016, v1.0 | 1.00 | MODELS | Computer | 2000-01-01 to 2016-12-31 |
N: 72 S: 17 E: -65 W: -180 |
CSV, RData | |
| DISCOVER-AQ California Deployment P-3B Aircraft In Situ Trace Gas Data | 1 | P-3B | TD-LIF, DACOM, DFGAS, Picarro G2301-m, PTR-MS, LI-6252 | 2013-01-09 to 2013-02-10 | ICARTT | ||
| DISCOVER-AQ California Deployment P-3B Aircraft Merged Data Files | 1 | P-3B | Computer | 2013-01-15 to 2013-02-08 | ICARTT | ||
| DISCOVER-AQ California Deployment San Joaquin Valley Air Pollution Control District Ground Site Data | 1 | GROUND STATIONS | GAS SENSORS, TEMPERATURE SENSORS, PRESSURE SENSORS, Teledyne API Model T200UP NO-NO2 Analyzer, CAPS NO2 Analyzer, Teledyne API Model T200U NO/NO2/NOx Analyzer, LGR CRDS | 2013-01-04 to 2013-02-14 | ICARTT | ||
| DISCOVER-AQ Colorado Deployment Ancillary Model Data | 1 | MODELS, Data Analysis | Computer | 2014-07-14 to 2014-08-27 | NetCDF-3, ICARTT | ||
| DISCOVER-AQ Colorado Deployment P-3B Aircraft In Situ Trace Gas Data | 1 | P-3B | DACOM, TD-LIF, DFGAS, LI-6252, CHEMILUMINESCENCE, PTR-MS | 2014-07-06 to 2014-08-14 | ICARTT | ||
| DISCOVER-AQ Colorado Deployment P-3B Aircraft Merged Data Files | 1 | P-3B | Computer, SMPS, UHSAS, LASER SPECTROMETER, APS, CAS, CIP, CCN, TSI CPC-3025, TSI-3563 Neph, PSAP, PILS/IC, DMT SP2, DACOM, DLH, DFGAS, PTR-MS | 2013-09-03 to 2014-08-20 | ICARTT |
SHOWING 10 OF 561
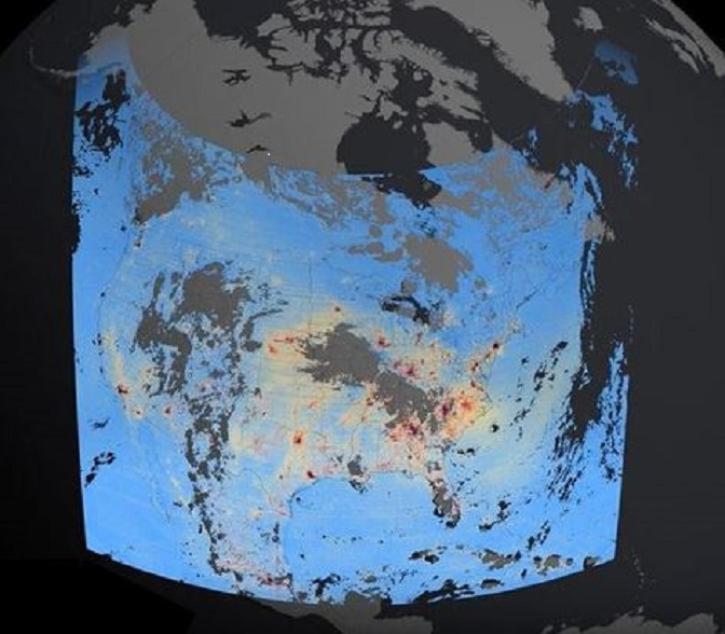
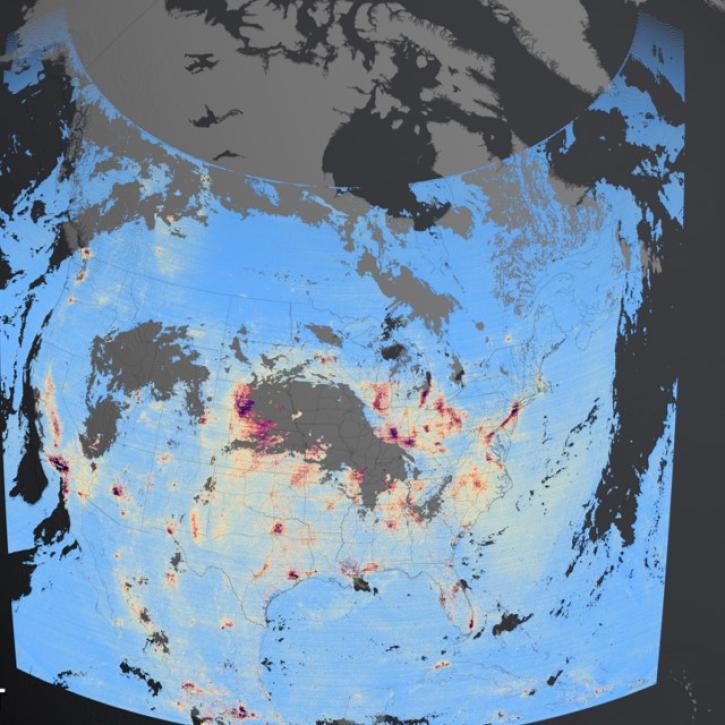
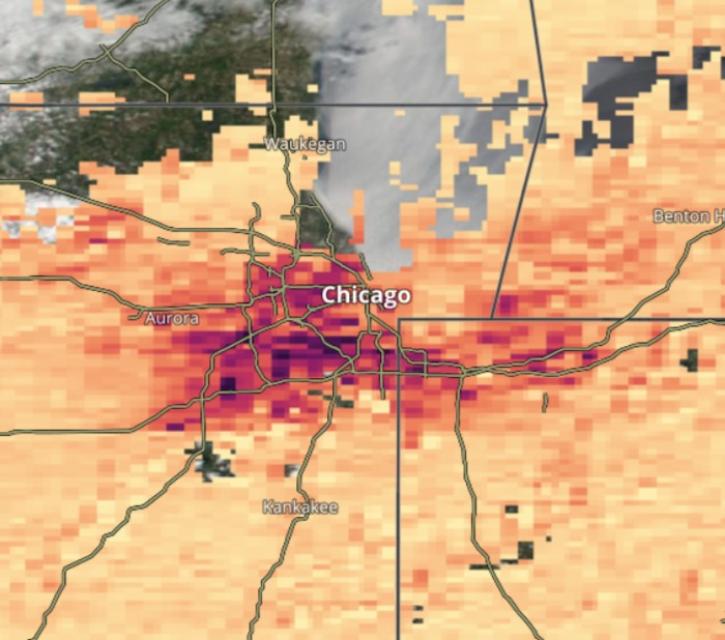
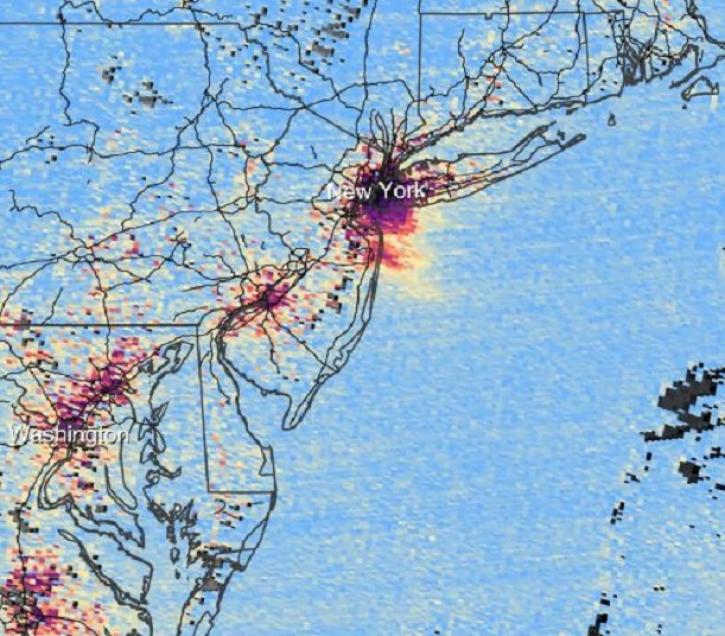
Featured Air Quality Observation Method: TEMPO
NASA's Tropospheric Emissions: Monitoring Pollution (TEMPO) instrument provides hourly measurements of O3, NO2, and other key elements of air pollution.
These new Tropospheric Emissions: Monitoring of Pollution (TEMPO) products will aid validation efforts and algorithm development, and will be used to expand the mission’s higher-level products.
5 MIN READ
This webinar provides an overview of the TEMPO mission and its data products and shows how to discover and access TEMPO data products using NASA's Earthdata Search.
The 14 layers from the Tropospheric Emissions: Monitoring of Pollution mission offer data on clouds, nitrogen dioxide, ozone, and more.
The beta release of Tropospheric Emissions: Monitoring of Pollution (TEMPO) mission data products lets users begin developing applications using these data.
Air Quality Data Tools
| Tool Sort descending | Description | Services | |
|---|---|---|---|
| AppEEARS | The The Application for Extracting and Exploring Analysis Ready Samples (AppEEARS) offers users a simple and efficient way to perform data access and transformation processes. | Search and Discovery, Subsetting, Customization, Downloading, Visualization | |
| CASEI | The Catalog of Archived Suborbital Earth Science Investigations (CASEI) is a comprehensive inventory of contextual information for NASA's Earth Science airborne and field campaigns. | Search and Discovery, Cataloging | |
| FIRMS | The Fire Information for Resource Management System (FIRMS) provides access to satellite imagery, active fire/hotspots, and related products to identify the location, extent, and intensity of wildfire activity. | Access, Visualization | |
| Panoply | Panoply is a cross-platform application that plots geo-referenced and other arrays from netCDF, HDF, GRIB, and other datasets. | Visualization, Customization, Reformatting, Subsetting, Comparison | |
| VEDA | NASA's Visualization, Exploration, and Data Analysis (VEDA) project is an open-source science cyberinfrastructure for data processing, visualization, exploration, and geographic information systems (GIS) capabilities. | Access, Analysis, Processing, Visualization, Geoprocessing |
SHOWING 5 OF 5
Frequently Asked Questions
Earthdata Forum
Our online forum provides a space for users to browse thousands of FAQs about research needs, data, and data applications. You can also submit new questions for our experts to answer.
Submit Questions to Earthdata Forumand View Expert Responses