NASA Has a Big Impact on AGU Dataset Compilation

In 2025, AGU proposed a compilation of "impactful datasets" that have significantly influenced Earth, space, and environmental science. NASA-funded teams developed several of them.

In 2025, the American Geophysical Union (AGU) proposed a compilation of "impactful datasets" that have significantly influenced Earth, space, and environmental science. The organization asked scientists to nominate a dataset that had been especially important to their field or that had contributed to a significant body of research. 

As one of the largest scientific organizations in the United States and the world, AGU’s nominations represented nearly every imaginable sector of space and Earth science. The datasets came from hydrology, lithology, geodesy, agronomy, speleology, and oceanography, along with many other fields. 

Several nominated datasets came from NASA. These datasets originated from numerous missions and research projects in space, planetary, and Earth science.

The process of selecting the datasets is described in a recent AGU Advances article—"Impactful Datasets in Earth, Space, and Environmental Sciences: Highlighting the Data That Transform Research" (Gum et al. 2026)—that describes the initial collection. The entire listing, 134 datasets organized into nine broad categories, can be found on Zenodo: Impactful Datasets in the Earth, Space, and Environmental Sciences. AGU plans to continue adding impactful datasets via subsequent calls for nominations. 

The term "impactful" reflects three sustainability dimensions: 

  • people—a positive impact on individuals via education, training, disaster response, and prediction; 
  • planet—a positive impact on physical systems, which include activities related to geophysical phenomena, conservation, climate, and environmental indicators;
  • prosperity—a positive impact on socioeconomic systems, which promote economic good, social equity, humanitarian relief, and community resilience. 

This article briefly summarizes NASA’s notable contributions to the impactful Earth science datasets, organized by the AGU dataset categories. Note that many of the summaries provided below are modified from the descriptions and supporting information provided by the nominators. Complete nomination information is included in the online dataset listing.

Image
Image Caption

Datasets like this from the OCO-3 mission enable detailed investigations of the natural and anthropogenic processes that influence CO2 release into and uptake from Earth's atmosphere.

Atmospheric Science, Space Weather

OCO-2 & -3 XCO2 & SIF

Four complementary datasets (OCO-2 and OCO-3 XCO2 & SIF) from the Orbiting Carbon Observatory-2 (OCO-2) satellite and the OCO-3 instrument (deployed on the International Space Station) provide the most accurate measurements ever made of atmospheric carbon dioxide (CO2) concentration. OCO-2 has provided data since 2014, and OCO-3 since 2019. With unprecedented spatial resolution, these datasets enable detailed investigations of the natural and anthropogenic processes that influence CO2 release into, and uptake from, the atmosphere. The data are vital for research into Earth’s radiative balance and applications including agriculture and energy production.

NASA Earth Exchange Global Daily Downscaled Projections (NEX-GDDP) CMIP5 & CMIP6

NEX-GDDP-CMIP6 provides global, bias-corrected daily climate projections downscaled to a 0.25-degree (~25 km) grid for the period 1950-2100. The data are generated with the daily Bias Correction Spatial Disaggregation (BCSD) method from 35 CMIP6 global climate models across the historical experiment and all four Tier 1 Shared Socioeconomic Pathway scenarios (SSP1-2.6, SSP2-4.5, SSP3-7.0, and SSP5-8.5). Covering the full globe at daily resolution, these data support assessments of climate change impacts on local and regional processes, including those sensitive to fine-scale variations in climate and topography.

Integrated Multi-satellitE Retrievals for the Global Precipitation Measurement (GPM) mission (IMERG)

IMERG is the global precipitation dataset derived from data acquired by the Global Precipitation Measurement (GPM) project. The GPM Core Observatory launched in 2014, but IMERG also uses data from multiple satellite sensors and ground stations.

IMERG provides high-quality precipitation data products with a maximum temporal resolution of 30 minutes and a maximum spatial resolution of 0.1° x 0.1° (approximately 10 km) globally. Initial (“early”) data are available with only 4 hours delay. Refined second run (“late”) data are available at 14 hours with more input data; and a research-quality dataset (“final”) is provided about 4 months after observation. Furthermore, by combining ground station records and data from the Tropical Rainfall Measuring Mission (TRMM), the IMERG dataset extends from 1998 to the present.

IMERG data are widely used in weather and climate research, as well as in applications such as drought monitoring, extreme weather prediction and response, agriculture, and water resources. It is especially useful for regions with little or no ground-based weather station coverage.

Modern-Era Retrospective analysis for Research and Applications, Version 2 (MERRA-2)

The refined Version 2 of the MERRA dataset, MERRA-2, provides global coverage of meteorological and hydrological variables beginning in 1980 at a spatial resolution of 0.5 ° x 0.625° (about 50 km). By combining modeling with observational data, MERRA-2 provides global data at high spatial and temporal resolution. 

The Goddard Modeling and Assimilation Office (GMAO) created MERRA-2 using its modeling expertise. GMAO authored the Goddard EOS-5 (GEOS-5) model, which incorporates remote sensing data from Earth Observing System (EOS) satellites and numerous precursor instruments. 

The MERRA-2 reanalysis uses several algorithms to calculate hundreds of variables. These variables include surface temperature, atmospheric trace gas concentrations, dust mass, cloud fraction, aerosol optical depth, particulate matter and black carbon concentration, evapotranspiration, geopotential height, and heat and energy fluxes. MERRA-2 also provides numerous variables primarily intended for meteorological research use.

GPCP Version 3.3 Satellite-Gauge (SG) Combined Precipitation Data Set

The Global Precipitation Climatology Project (GPCP)—funded by NASA’s Making Earth System Data Records for Use in Research Environments (MEaSUREs) program—is the precipitation component of an internationally coordinated set of (mainly) satellite-based global products dealing with the Earth's water and energy cycles. GPCP was initially developed and coordinated under the auspices of the Global Water and Energy Experiment (GEWEX) Data and Assessment Panel (GDAP) of the World Climate Research Program (WCRP). Major climate assessments, including reports from the Intergovernmental Panel on Climate Change (IPCC), often cite GPCP. 

The GPCP Version 3 suite currently consists of 0.5o monthly and daily products. GPCP represents a long-term effort to produce a precipitation climate data record (CDR), while continually incorporating guidance from the most advanced satellite observations. A precipitation dataset that meets rigorous CDR criteria enables the study, understanding, and monitoring of precipitation distribution patterns; of large-scale phenomena that affect them (such as El Niño/Southern Oscillation events); and of seasonal and interannual variations and trends. CDRs are also vital for the validation and further development of Earth system numerical models.

Atmospheric Infrared Sounder (AIRS)

AIRS is a hyperspectral infrared sounder on the NASA Aqua spacecraft that covers the 3.7-15.4 μm infrared spectral region with 2378 channels and a 13.5 km nadir spatial resolution. AIRS launched into a 705 km orbit on May 4, 2002, and has been collecting data essentially uninterrupted since September 2002. AIRS routinely uses measured radiances to retrieve vertical profiles of atmospheric temperature, water vapor, and key atmospheric gas constituents (ozone, carbon monoxide, carbon dioxide, and methane), as well as cloud and surface parameters. 

AIRS infrared radiance data are operationally assimilated in all major global weather prediction systems, including those of the European Centre for Medium-range Weather Forecasts (ECMWF), the U.S. National Weather Service (NWS), and the U.S. Navy. Assimilation of AIRS into global weather prediction systems was a major early success; some studies consider it the most impactful single instrument ever in improving forecast accuracy.


Earth Surface, Natural Hazards, Geology, Near-Surface Geophysics

ECOSTRESS Tiled Land Surface Temperature and Emissivity Instantaneous L2 Global 70 m V002

The ECOsystem Spaceborne Thermal Radiometer Experiment on Space Station (ECOSTRESS) is an instrument that began operations on the International Space Station (ISS) in July 2018. 

ECOSTRESS monitors surface heat at the street or sub-city block scale at different times of day. This data provides the highest combination of spatial and temporal resolution currently available for surface heat monitoring. This dataset also enables monitoring of surface temporal anomalies associated with volcanic and hydrothermal activity and active wildfires, supporting hazard evaluation and response across multiple hazardous conditions. 

The ECOSTRESS Tiled Land Surface Temperature and Emissivity Instantaneous Level 2 Global 70 m (ECO_L2T_LSTE) Version 2 data product provides atmospherically corrected land surface temperature and emissivity (LST&E) values derived from the five thermal infrared (TIR) bands of the ECOSTRESS radiometer. LST&E enable higher-level ECOSTRESS products such as global mineral maps, evapotranspiration, the evaporative stress index, and water use efficiency, the latter three of which relate to plant stress and water resources. 
 

Earth’s Interior, Geodesy

Ground-Based Global Navigation Satellite System (GNSS) Hatanaka-compressed Observation Data (1-second sampling, sub-hourly files)

The Ground-Based Global Navigation Satellite System (GNSS) Hatanaka-compressed Observation Data (1-second sampling, sub-hourly files) dataset consists of GNSS observational data providing autonomous geospatial positioning with global coverage. The GNSS datasets from ground receivers consist primarily of data from the U.S. Global Positioning System (GPS) and the Russian GLObal NAvigation Satellite System (GLONASS). Since 2011, the GNSS archive has included data from several other GNSS sources similar to the U.S. GPS in satellite constellation, orbits, and signal structure. 

The GNSS dataset is used for education and training in the fields of geodesy and geophysics. It can support both research and field response operations for geological events that cause rapid ground deformation, including earthquakes, volcanic eruptions, landslides, earthflows, and rapid erosion. These data support post-event response and analysis and improve early warning systems. 

Furthermore, GNSS data support research on ionospheric and atmospheric phenomena caused by solar storms, powerful weather systems, and climate change. Because GNSS data are highly sensitive to surface motion, they also support research and monitoring of glacier and ice sheet dynamics and ground surface changes. Many of these hazards can have significant financial implications, making GNSS data important to national and international economies. 
 

Education, Geohealth, Society

Gridded Population of the World (GPW)

The Gridded Population of the World (GPW) is the Center for Integrated Earth System Information’s (CIESIN) flagship data product and a foundational dataset in Earth sciences. GPW was the first globally gridded population dataset, developed to facilitate data integration between the Earth and social sciences. Researchers have used it in countless studies on population exposure to environmental hazards, the distribution of populations at risk of various diseases, and simple population counts across geographies, among other things.

GPWv4, the most recent version (version 5 is in production), provides human population estimates based on counts consistent with national censuses and population registers for 2000, 2005, 2010, 2015, and 2020. For more information, see de Sherbinin, A. (2017). Remote sensing and socioeconomic data integration: Lessons from the NASA Socioeconomic Data and Applications Center.

Image
Image Caption

GEDI data allow researchers to remotely measure the canopy cover (left image) and the relative height of the stands of trees in that forest (right), allowing researchers to gain a three-dimensional view of the area and aiding the estimation of biomass.

Global Environmental Change, Paleoceanography and Paleoclimatology, Biogeoscience

GEDI02_B: GEDI L2B Footprint Level Canopy Cover and Vertical Profile Metrics

The Global Ecosystem Dynamics Investigation (GEDI) sensor on the International Space Station uses lasers to precisely measure the height, density, and three-dimensional structure of the forest canopy. The GEDI02_B dataset provides precise latitude, longitude, elevation, height, forest canopy cover, and vertical profile metrics. These data provide the first globally consistent measurements of forests, while enabling better estimates of the role of forests in Earth’s carbon cycle.

ABCFlux v2: Arctic–Boreal CO2 and CH4 In-situ Flux and Environmental Data

An important method for characterizing changes in the Arctic and boreal forest is measuring processes that absorb and release carbon as carbon dioxide (CO2) and methane (CH4). The ABCFlux v2 dataset assembles these measurements and synthesizes terrestrial and freshwater CO2 and CH4 fluxes from the Arctic-Boreal region, aggregated to monthly time steps. ABCFlux v2 includes surface-atmosphere CO2 fluxes of net ecosystem exchange (NEE), gross primary production (GPP), and ecosystem respiration (Reco) alongside CH4 fluxes. It also provides detailed measurements of more than 70 associated environmental and meteorological variables.

ABCFlux v2 captures data from more than 1,000 sites across various ecosystems, including boreal forests, wetlands, tundras, and freshwater systems. The product provides the most comprehensive synthesis to date of site-level ecosystem-atmosphere fluxes across rapidly changing northern latitudes—a substantial advance in our ability to understand carbon fluxes. 

The dataset directly extends ABCFlux v1, which has been used to inform assessments such as the Arctic Report Card 2024. ABCFlux v2 enables scientific analyses that support data-driven decision-making and inform the development of climate policies and mitigation strategies. 

NCEP/CPC L3 Half Hourly 4km Global (60S - 60N) Merged IR

NCEP/CPC L3 Half Hourly 4km Global (60S - 60N) Merged IR, a gridded, global, merged multi-satellite geostationary infrared (IR) brightness temperature product, comes from the NOAA Climate Prediction Center (CPC), the National Centers for Environmental Prediction (NCEP), and the National Weather Service (NWS). The dataset contains IR brightness temperature data at 4 km spatial resolution, merged from European, Japanese, and U.S. geostationary satellites active from 1998 to the present. The temporal resolution is 30 minutes between latitudes 60°S-60°N. NASA post-processes the original binary data into a self-documenting, CF-compliant netCDF-4 format, allowing a broad range of applications to access the data directly.

Remote video URL

The Merged IR dataset plays an important role in weather forecasting and environmental monitoring. Geostationary IR data provide continuous, real-time observations for tracking weather patterns, such as hurricanes, fronts, and atmospheric rivers, and especially for short-term forecasting. Scientists use IR data to monitor cloud cover, ocean currents, volcanic ash and eruption clouds, and vegetation, helping them study climate change and environmental phenomena. 

IR data is widely used in disaster management, including tracking wildfires and providing crucial information for emergency response. Merged IR data also derive atmospheric motion vectors, which play a critical role in applications such as weather forecasting models and algorithms. 

OPERA Land Surface Disturbance Alert from Harmonized Landsat Sentinel-2 product (Version 1) OPERA_L3_DIST-ALERT-HLS_V1

The Observational Products for End-Users from Remote Sensing Analysis (OPERA) project uses optical and synthetic aperture radar (SAR) imagery to compose data products for Earth scientists. 

The Land Surface Disturbance Alert (DIST-ALERT) data product indicates vegetation disturbances on Earth’s surface at 30-meter resolution. This is accomplished by harmonizing data from the NASA/U.S. Geological Survey Landsat 8 and 9 satellites and similar instruments on the European Space Agency’s Sentinel-2A, -2B, and -2C satellites to produce the HLS data product (OPERA_L3_DIST-ALERT-HLS_V1). For this product, a vegetation disturbance alert is triggered when vegetation cover within an HLS pixel decreases. These data are the highest temporal frequency data available at medium spatial resolution. 

DIST-ALERT delivers the first global, near-real-time monitoring of vegetation disturbance across all terrestrial ecosystems, including grasslands, savannas, shrublands, wetlands, and croplands. It enables rapid detection of deforestation, degradation, and other disturbances worldwide. 

DIST-ALERT also underpins the Land Disturbance Alert Classification System (LDACS), which classifies each disturbance as likely natural or human-driven. DIST-ALERT is particularly important for monitoring and protecting high-priority conservation areas, such as protected areas, biodiversity hotspots, and Indigenous lands. DIST-ALERT supports sustainable economic development and governance by providing reliable data for supply-chain monitoring, regulatory compliance, and conservation planning. 

Image
Image Caption

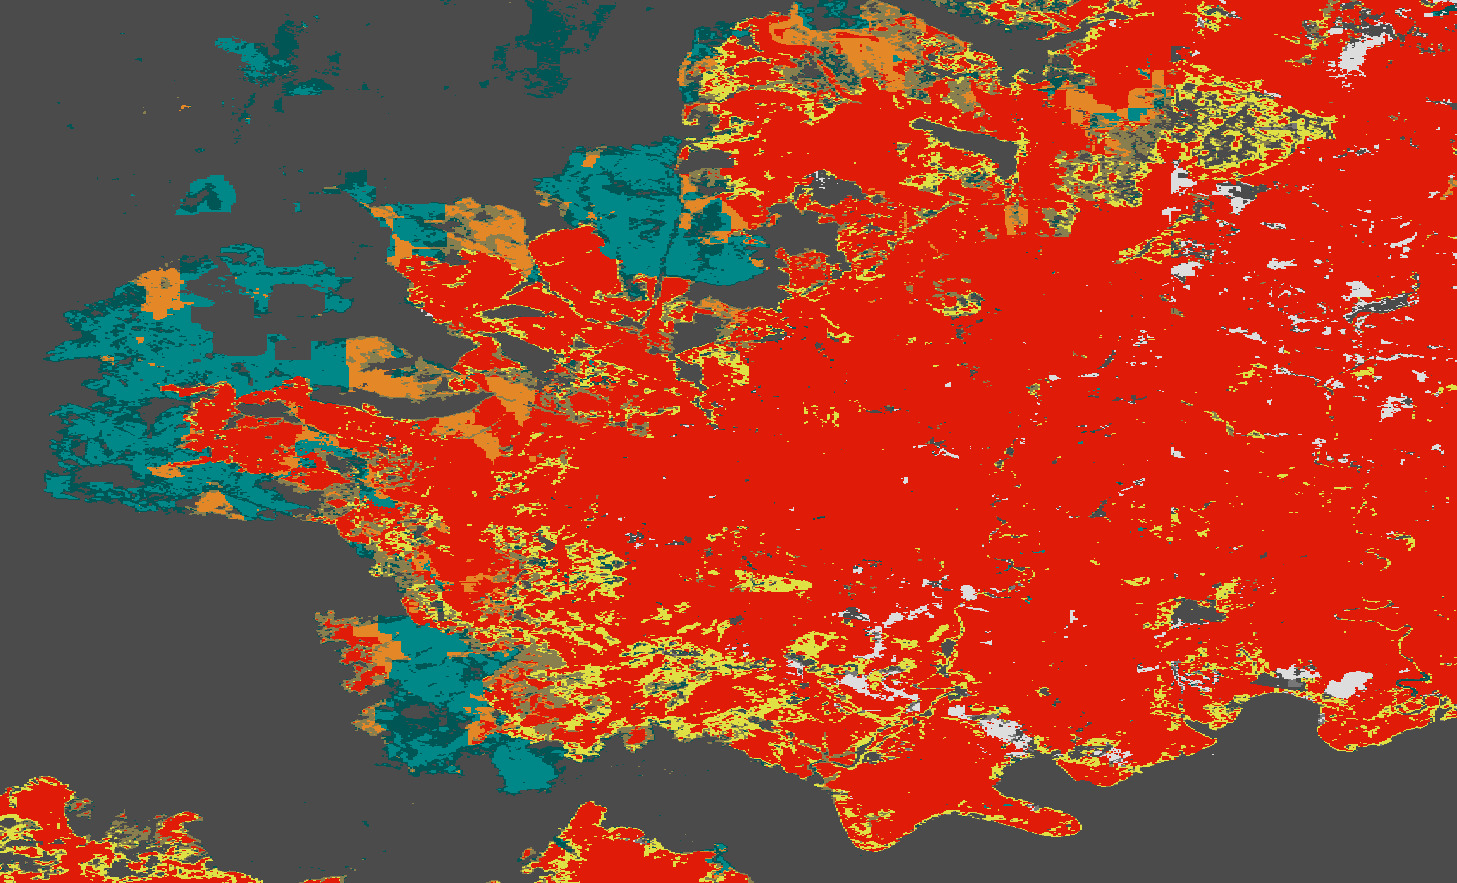
This Observational Products for End-Users from Remote Sensing Analysis (OPERA) dataset uses optical and synthetic aperture radar (SAR) imagery to help estimate land disturbance near Grampians National Park in Australia.

Ocean Science, Hydrology, Cryosphere

SWOT Post-Launch Field Campaign Data

SWOT (Surface Water and Ocean Topography) is a NASA satellite mission that measures sea surface height with a radar altimeter. In this dataset, SWOT Post-Launch Field Campaign Data, temperature and salinity data from stationary moorings and mobile ocean-going platforms (“gliders”)  that were initially acquired for mission calibration and validation efforts have been aggregated with satellite observations from SWOT. The data measure features of ocean circulation, internal waves, and mesoscale variability. Combining this in situ dataset with SWOT satellite data is expected to yield exciting new insights into ocean processes across many spatial and temporal scales.

GLDAS Catchment Land Surface Model L4 daily 0.25o x 0.25o GRACE-DA1 V2.2

The NASA Global Land Data Assimilation System (GLDAS) project creates several datasets for primarily hydrological data variables, which estimate land surface states and fluxes with global coverage and high spatial (0.25o) and temporal (every 3 hours) resolution. The GLDAS data products are generated by running several different land surface models (LSMs) with meteorological input data from various sources. Output variables include water-balance states and fluxes (such as runoff, soil moisture, and snow water equivalent), as well as energy-balance states and fluxes (such as land surface temperature and latent and sensible heat flux). 

GLDAS-2.2, the newest data collection, advances the ability to measure a valuable component of the global water budget: groundwater storage. GLDAS-2.2 assimilates terrestrial water storage retrievals from the Gravity Recovery and Climate Experiment (GRACE) and GRACE Follow-On (GRACE-FO) missions to constrain its groundwater storage estimates. This contrasts with other LSM-based groundwater estimates, which usually lack explicit representation of aquifers, lateral groundwater flow, and human impacts such as irrigation.

LSM frameworks like GLDAS matter because they estimate variables that are otherwise difficult to observe but have profound implications for society and the food supply. For example, GLDAS runoff estimates enable hydrologists to forecast streamflow, which informs reservoir storage/release decisions, floodplain mapping, and drought monitoring.  GLDAS-2.2 data have been used to detect and quantify groundwater changes worldwide, including California’s agriculturally vital Central Valley, Spain, Poland, Indonesia, India, Africa’s Sahel region, Nigeria, and South Africa. 

Details

Last Updated

Nov. 16, 2026

Published