Introduction

Water vapor mixing ratio (WVMR) is a variable that can be used to determine the amount of water vapor in the atmosphere. It represents the ratio of the mass of water vapor to dry air, typically expressed in units of grams per kilogram (g/kg). In meteorology, vertical soundings record variables such as dewpoint temperature and pressure. These two variables can be used to compute WVMR at any pressure level of the atmosphere and are simpler to obtain than directly measuring the amount of water vapor itself. WVMR is thus the variable usually reported from a sounding (Figure 1). 

WVMR typically decreases nonlinearly with altitude, and knowledge of the exact distribution of WVMR followed by integration is needed to compute the true value of precipitable water vapor (PWV) for a whole column or layer of the atmosphere, making PWV a challenging measurement to obtain with precision. However, with spaceborne instruments like NASA’s Atmospheric Infrared Sounder (AIRS), we can provide very close, near-theoretical approximations of the PWV in the atmosphere. 

This tutorial demonstrates how to convert WVMR to PWV using an AIRS sounding produced by NASA’s Giovanni. Read on to explore methods for converting WVMR to PWV for a layer of the atmosphere and for computing the total column water vapor (TCWV). 

Precipitable Water Vapor

To estimate PWV, we used a vertical profile of WVMR from AIRS on August 24, 2017, to represent the PWV available ahead of Hurricane Harvey as the storm rapidly strengthened into a Category 4 hurricane. This occurred shortly before Harvey made landfall near Rockport, Texas, on August 25, 2017.

Image

Figure 1. Area-averaged AIRS WVMR vertical profile from Giovanni on August 24, 2017, over coastal Texas. The x-axis represents the water vapor mixing ratio in g/kg. Air pressure is shown on the y-axis with logarithmic scaling, and each tick represents 100 hPa. 

The map in the upper-right corner shows the spatial bounds of the domain used to compute the vertical profile.

Tip: Reverse the min and max range values after plotting the Giovanni Vertical Profile to get descending pressure on the y-axis.

Credit: GES DISC

To estimate the PWV in a layer of the atmosphere, we can use the following equation:

Image

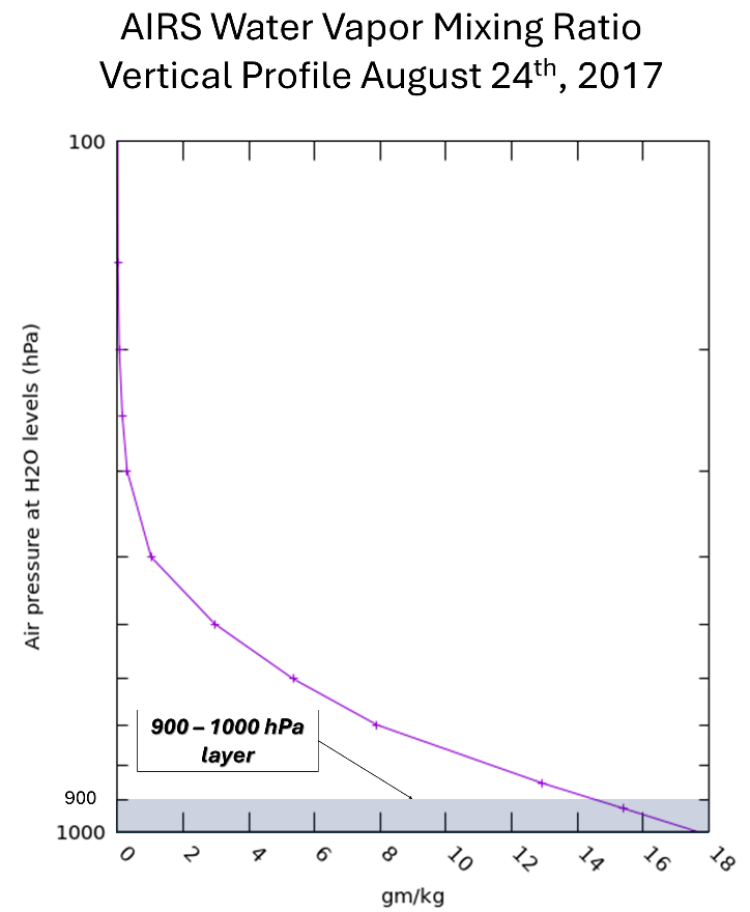
where r̄ is the average water vapor mixing ratio between pressure layers, P1 (lower bound) and P2 (upper bound) given in hectopascals (hPa), and g represents Earth’s gravity at ~10 m/s2. For the example below, we estimate PWV by first identifying a layer in the atmosphere. In this case the 900 – 1000 hPa layer will be used.

Image

Figure 2. AIRS WVMR vertical profile from Figure 1 with the 900-1000 hPa pressure layer highlighted by the gray shaded area between 1000 hPa and 900 hPa. Credit: GES DISC

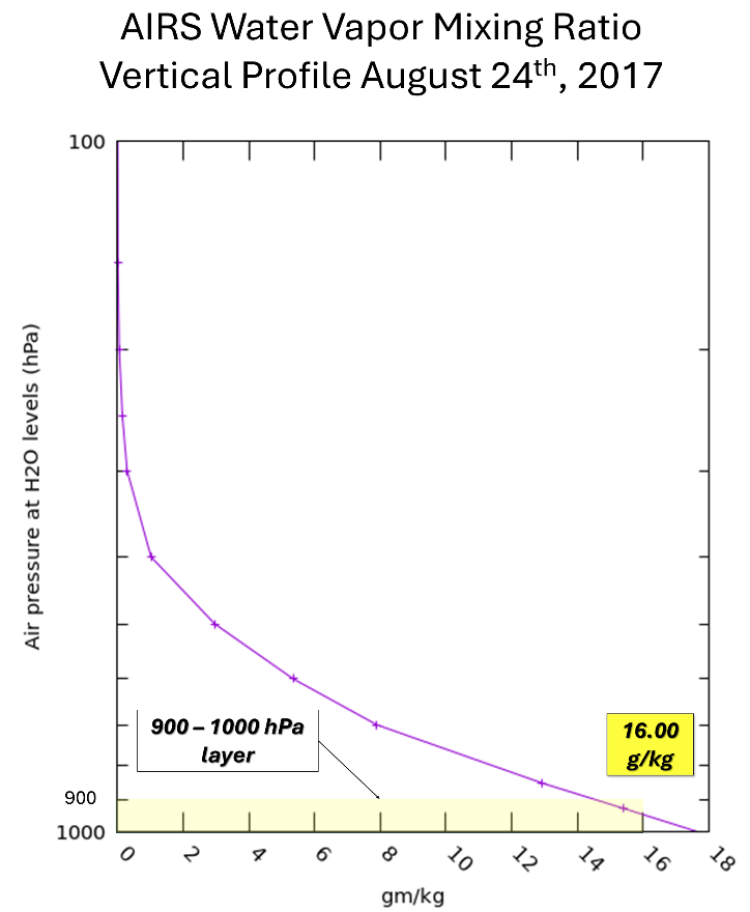
After identifying the pressure level, the next step is to estimate r̄, the average water vapor mixing ratio, in this layer. Notice that the WVMR is approximately 17.5 g/kg at 1000 hPa and 14.5 g/kg at 900 hPa. For this layer, r̄ would be approximately 16.0 g/kg (Figure 3). 

Image

Figure 3. AIRS WVMR vertical profile from Figure 1 with the estimation of the average water vapor mixing ratio (r̄) for the 900-1000 hPa layer. Credit: GES DISC

Now that r̄ has been estimated, the PWV can be computed for this layer. The equation previously described provides PWV in units of kilograms per meter squared (kg/m2), which is not the most intuitive unit for visualizing the depth of water that would fall from the atmosphere. One important conversion to remember is that 1 kg/m2 of water is equal to the depth of 1 millimeter (mm) of water over that same area. Therefore, for the 900 – 1000 hPa layer, there is 16.0 mm of PWV, which is how you can estimate single layer PWV from an AIRS sounding. 

An important note is that using a layer depth of 100 hPa simplifies the math for estimating PWV in mm directly from the sounding. For example, if we used r̄ = 16.0 g/kg, but between 950-1000 hPa, the PWV in that layer would equal 8 mm. 

Total Column Water Vapor

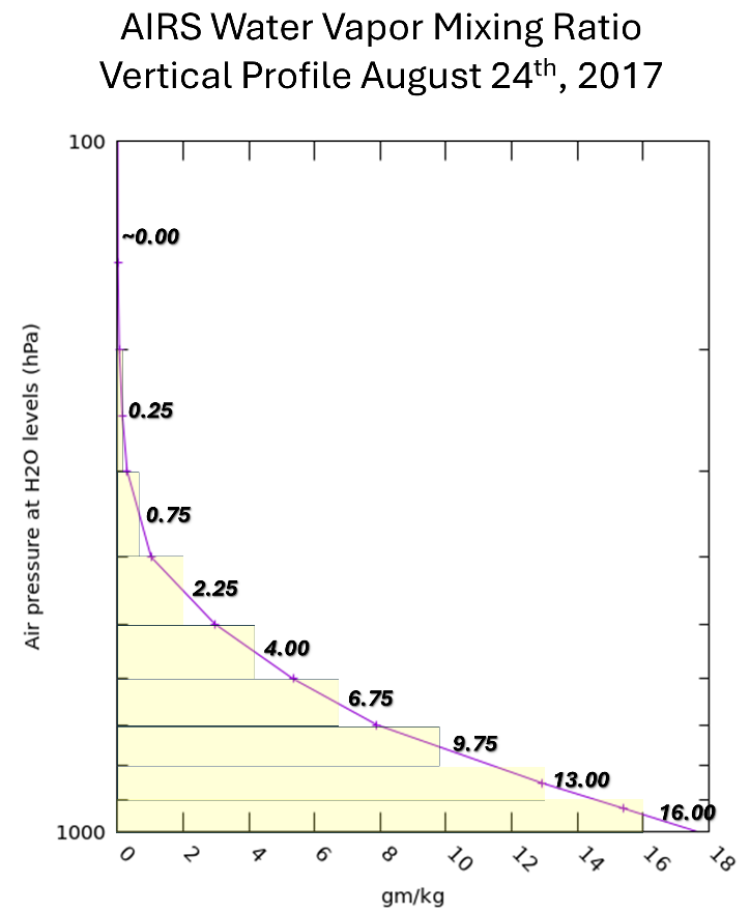
To estimate the TCWV for the entire depth of the atmosphere, the same steps in Figures 2 and 3 need to be repeated for each 100 hPa layer in the sounding from Figure 1, which is also shown below in Figure 4. Notice how the WVMR, and therefore the amount of PWV, decreases with pressure and increasing height in the atmosphere. This is because cooler air holds less water vapor, and since temperature decreases with height, the amount of water vapor the atmosphere can hold also decreases with height, approaching zero above 200 hPa. 

Image

Figure 4. AIRS WVMR vertical profile from Figure 3 with the estimation of the average water vapor mixing ratio (r̄) in each 100 hPa layer throughout the atmosphere. Credit: GES DISC

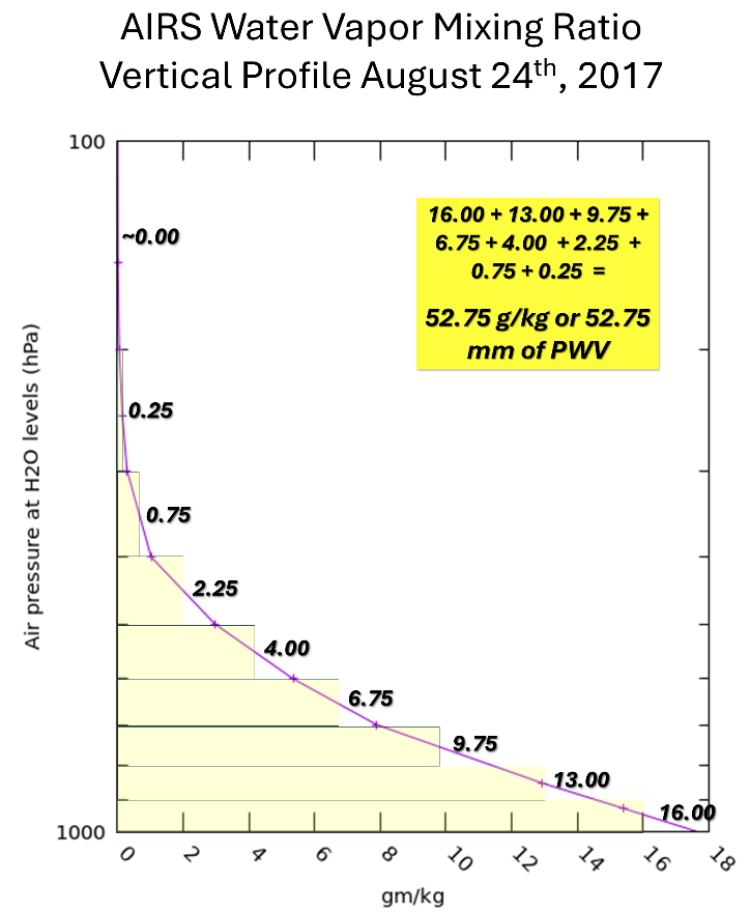
Now that r̄ has been estimated at each level of the atmosphere, all that remains to do is to add up all the PWV values from each layer to obtain the TCWV (Figure 5). 

Image

Figure 5. Estimation of total column PWV from AIRS WVMR vertical profile. Credit: GES DISC

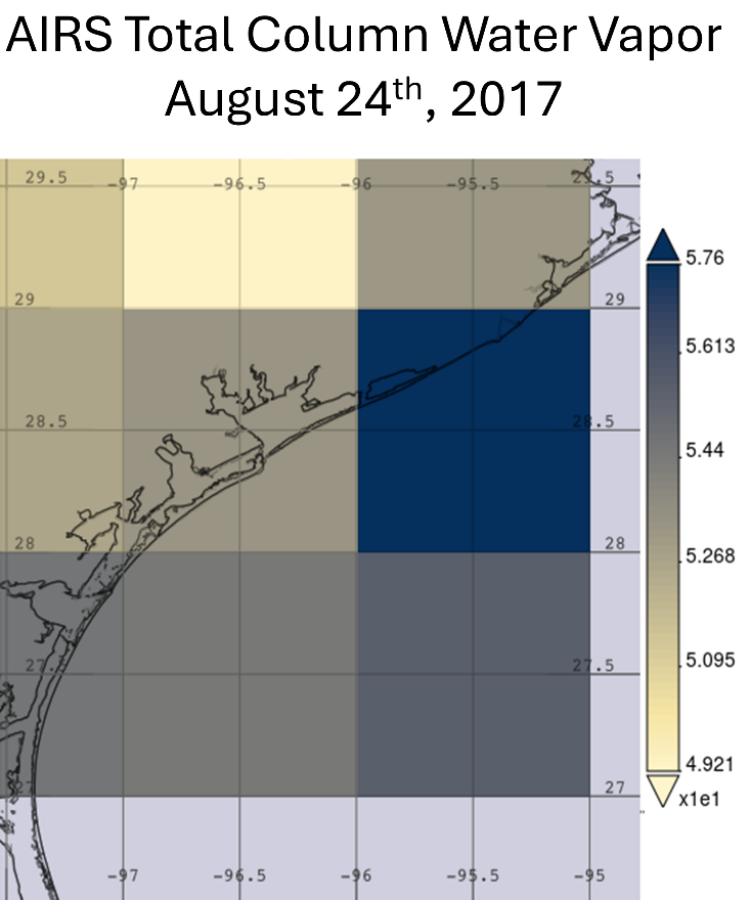
The TCWV from the August 24, 2017, sounding over coastal Texas is estimated at 52.75 mm. Comparing the estimated sounding values to the total column PWV from the AIRS dataset is a good benchmark to check the accuracy of our estimation. Below (Figure 6) is the spatial distribution of TCWV over the domain used to generate the vertical profiles of WVMR from AIRS on August 24. 

Image

Figure 6. AIRS Total Column Water Vapor on August 24, 2017. Credit: GES DISC

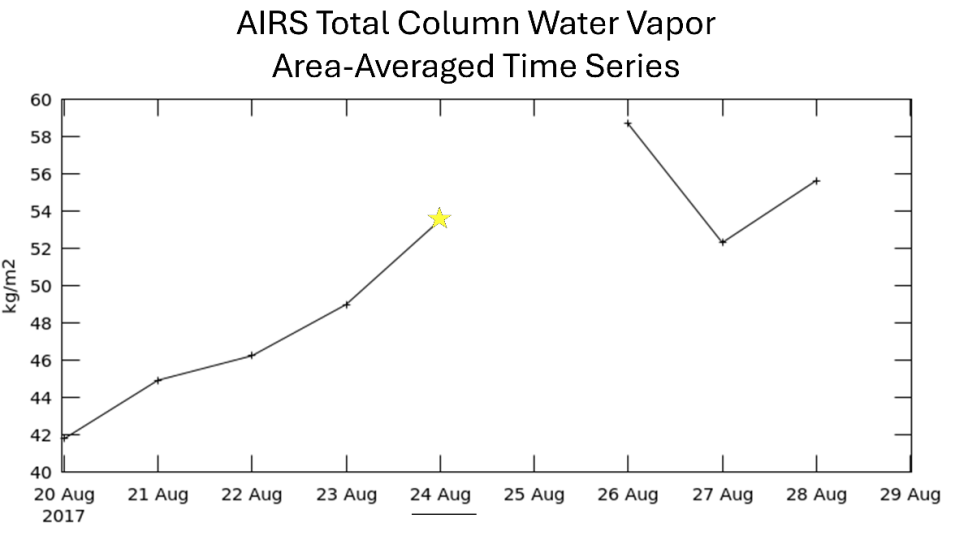
To compare the estimated total column PWV (52.75 mm) to the AIRS TCWV, the area-average time series feature in Giovanni is used to produce a time series of AIRS TCWV representative of the domain (Figure 7). 

Image
Image Caption

Figure 7. Area-averaged time series of AIRS total column water vapor from August 20 to August 29, 2017. The x-axis shows the date and the y-axis shows the total column water vapor in kg/m2 (remember 1 kg/m2 = 1 mm of water). The star highlights the date of interest, August 24, 2017, in which the value is compared to the estimate total column PWV from the sounding in Figure 5. Credit: GES DISC

The estimated TCWV from the AIRS August 24, 2017, sounding was 52.75 mm. By exporting the area-averaged time series from Giovanni to a CSV file, the AIRS TCWV for August 24, 2017, is calculated to be 53.52 mm. Evaluating the estimated TCWV computed in this tutorial with the AIRS TCWV product shows approximately a 1% difference and demonstrates the reliability of this technique to estimate PWV. 

Conclusion

The purpose of this tutorial was to demonstrate how to convert the WVMR values in an AIRS vertical profile to PWV. It was shown that for a 100 hPa layer, the average water vapor mixing ratio (r̄) in g/kg is equal to the same value in mm of PWV, which is also available as a variable from both MODIS instruments (Aqua and Terra) and from the Modern-Era Retrospective analysis for Research and Applications Version 2 (MERRA-2).

Additionally, MERRA-2 has a variable called specific humidity, which is very similar to WVMR except it is defined as the ratio of water vapor to the total mass of the air (instead of just dry air). Using specific humidity is a slightly more representative measurement of the water vapor in the air and only differs from WVMR by a few percent at most, so the same exercise can be performed with a MERRA-2 specific humidity vertical profile (just replace ≈ with = in the equation). 

Knowledge of the amount of PWV at each level is important during hurricane season, as low-level moisture can be a better indication of a hurricane’s moisture intake and ability to strengthen. In the case of Hurricane Harvey, there was plenty of moisture available, with area-averaged TCWV values greater than two inches (50.8 mm), which is extremely high for the area and time of year. These high TCWV values, aided by the dynamic forcings brought on by Hurricane Harvey, contributed to the strengthening of the storm leading up to landfall and the subsequent devastating flooding it caused in eastern Texas.

References

Stull, Roland. (2016). Chapter 4 Water Vapor. In Practical Meteorology: An Algebra-Based Survey of Atmospheric Science (pp. 87–118). Book, UBC. 

Atmospheric Water Vapor - Precipitable Water. (April 8, 2013).

The COMET Program/MetEd. (2018, June 22). Precipitable Water Definition [Video]. YouTube.

Details

Last Updated

Sept. 30, 2025

Published

Sept. 30, 2025

Data Archive

Goddard Earth Sciences Data and Information Services Center (GES DISC)