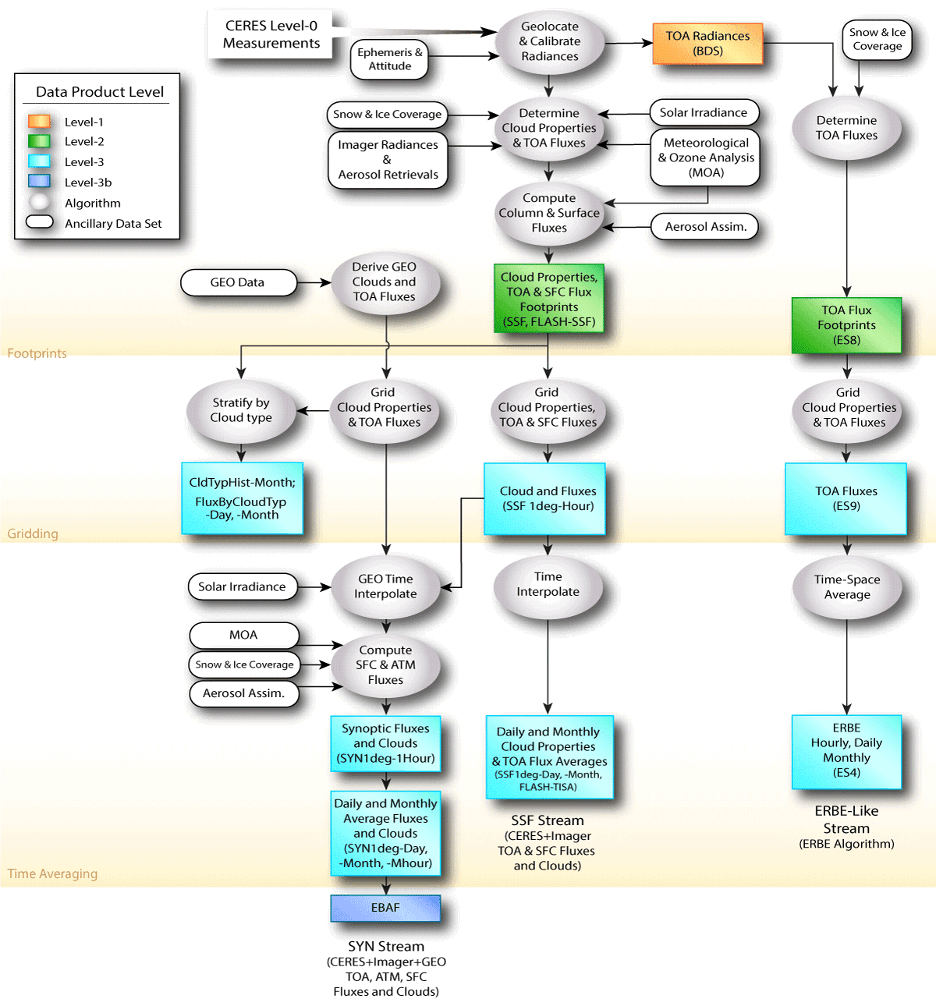
CERES uses a processing chain that involves several steps to produce the final flux products. The first step is to geolocate and calibrate the CERES observation in the BiDirection Scan (BDS). A subsequent part of this effort is determining consistent cloud properties which play a major role in the distribution of radiant energy and how it is proportioned at the surface, within the atmosphere, and at the ToA. The Moderate Resolution Imaging Spectrometer (MODIS) and Visible Infrared Imaging Radiometer Suite (VIIRS) coincident imagers are used to infer cloud fraction and calculate macro (top height, pressure and temperature) and micro (particle size, path) cloud properties. Together with the BDS, the co-located imager data are used to create the Single Scanner Footprint (SSF) data where cloud properties from the imager are convolved within the CERES footprint. The artifacts from the optics in the CERES instrument are removed to produced unfiltered radiance, and Angular Distribution Models (ADMs) are applied to obtain fluxes. The SSFs for a single cross-track instrument are gridded at one-degree for the SSF1deg-Hour product.
Using the resulting SSF, together with NASA’s Global Modeling and Assimilation Office (GMAO) reanalysis and the Fu-Liou Radiative Transfer Model (RTM), the Shortwave (SW) and Longwave (LW) fluxes are computed at the surface, at atmospheric levels of 850, 500, 200, and 70 hPa, as well as at the top of the atmosphere (ToA) for each CERES footprint. This creates the instantaneous computed fluxes in the Cloud and Radiative Swath (CRS) product. The CRS is gridded at one-degree creating the CRS1deg-Hour with instantaneous regional fluxes.
Other datasets used to create these products include National Snow and Ice Data Center (NSIDC) Near-Real Time Special Sensor Microwave Imager (SSMI) data, Special Sensor Microwave Imager / Sounder (SSMIS) or Advanced Microwave Scanning Radiometer (AMSR2) Equal Area Scalable Earth (EASE) Gridded Daily Global Ice and Snow Extent (NISE) data, MODIS or VIIRS Dark Target and Deep Blue aerosols, and Total solar irradiance data products. The imager aerosol data is incorporated into the internal CERES Model of Atmospheric Transport and CHemistry (MATCH) assimilation product. Yet additional imager data is also required to capture diurnal variability in the Earth system.
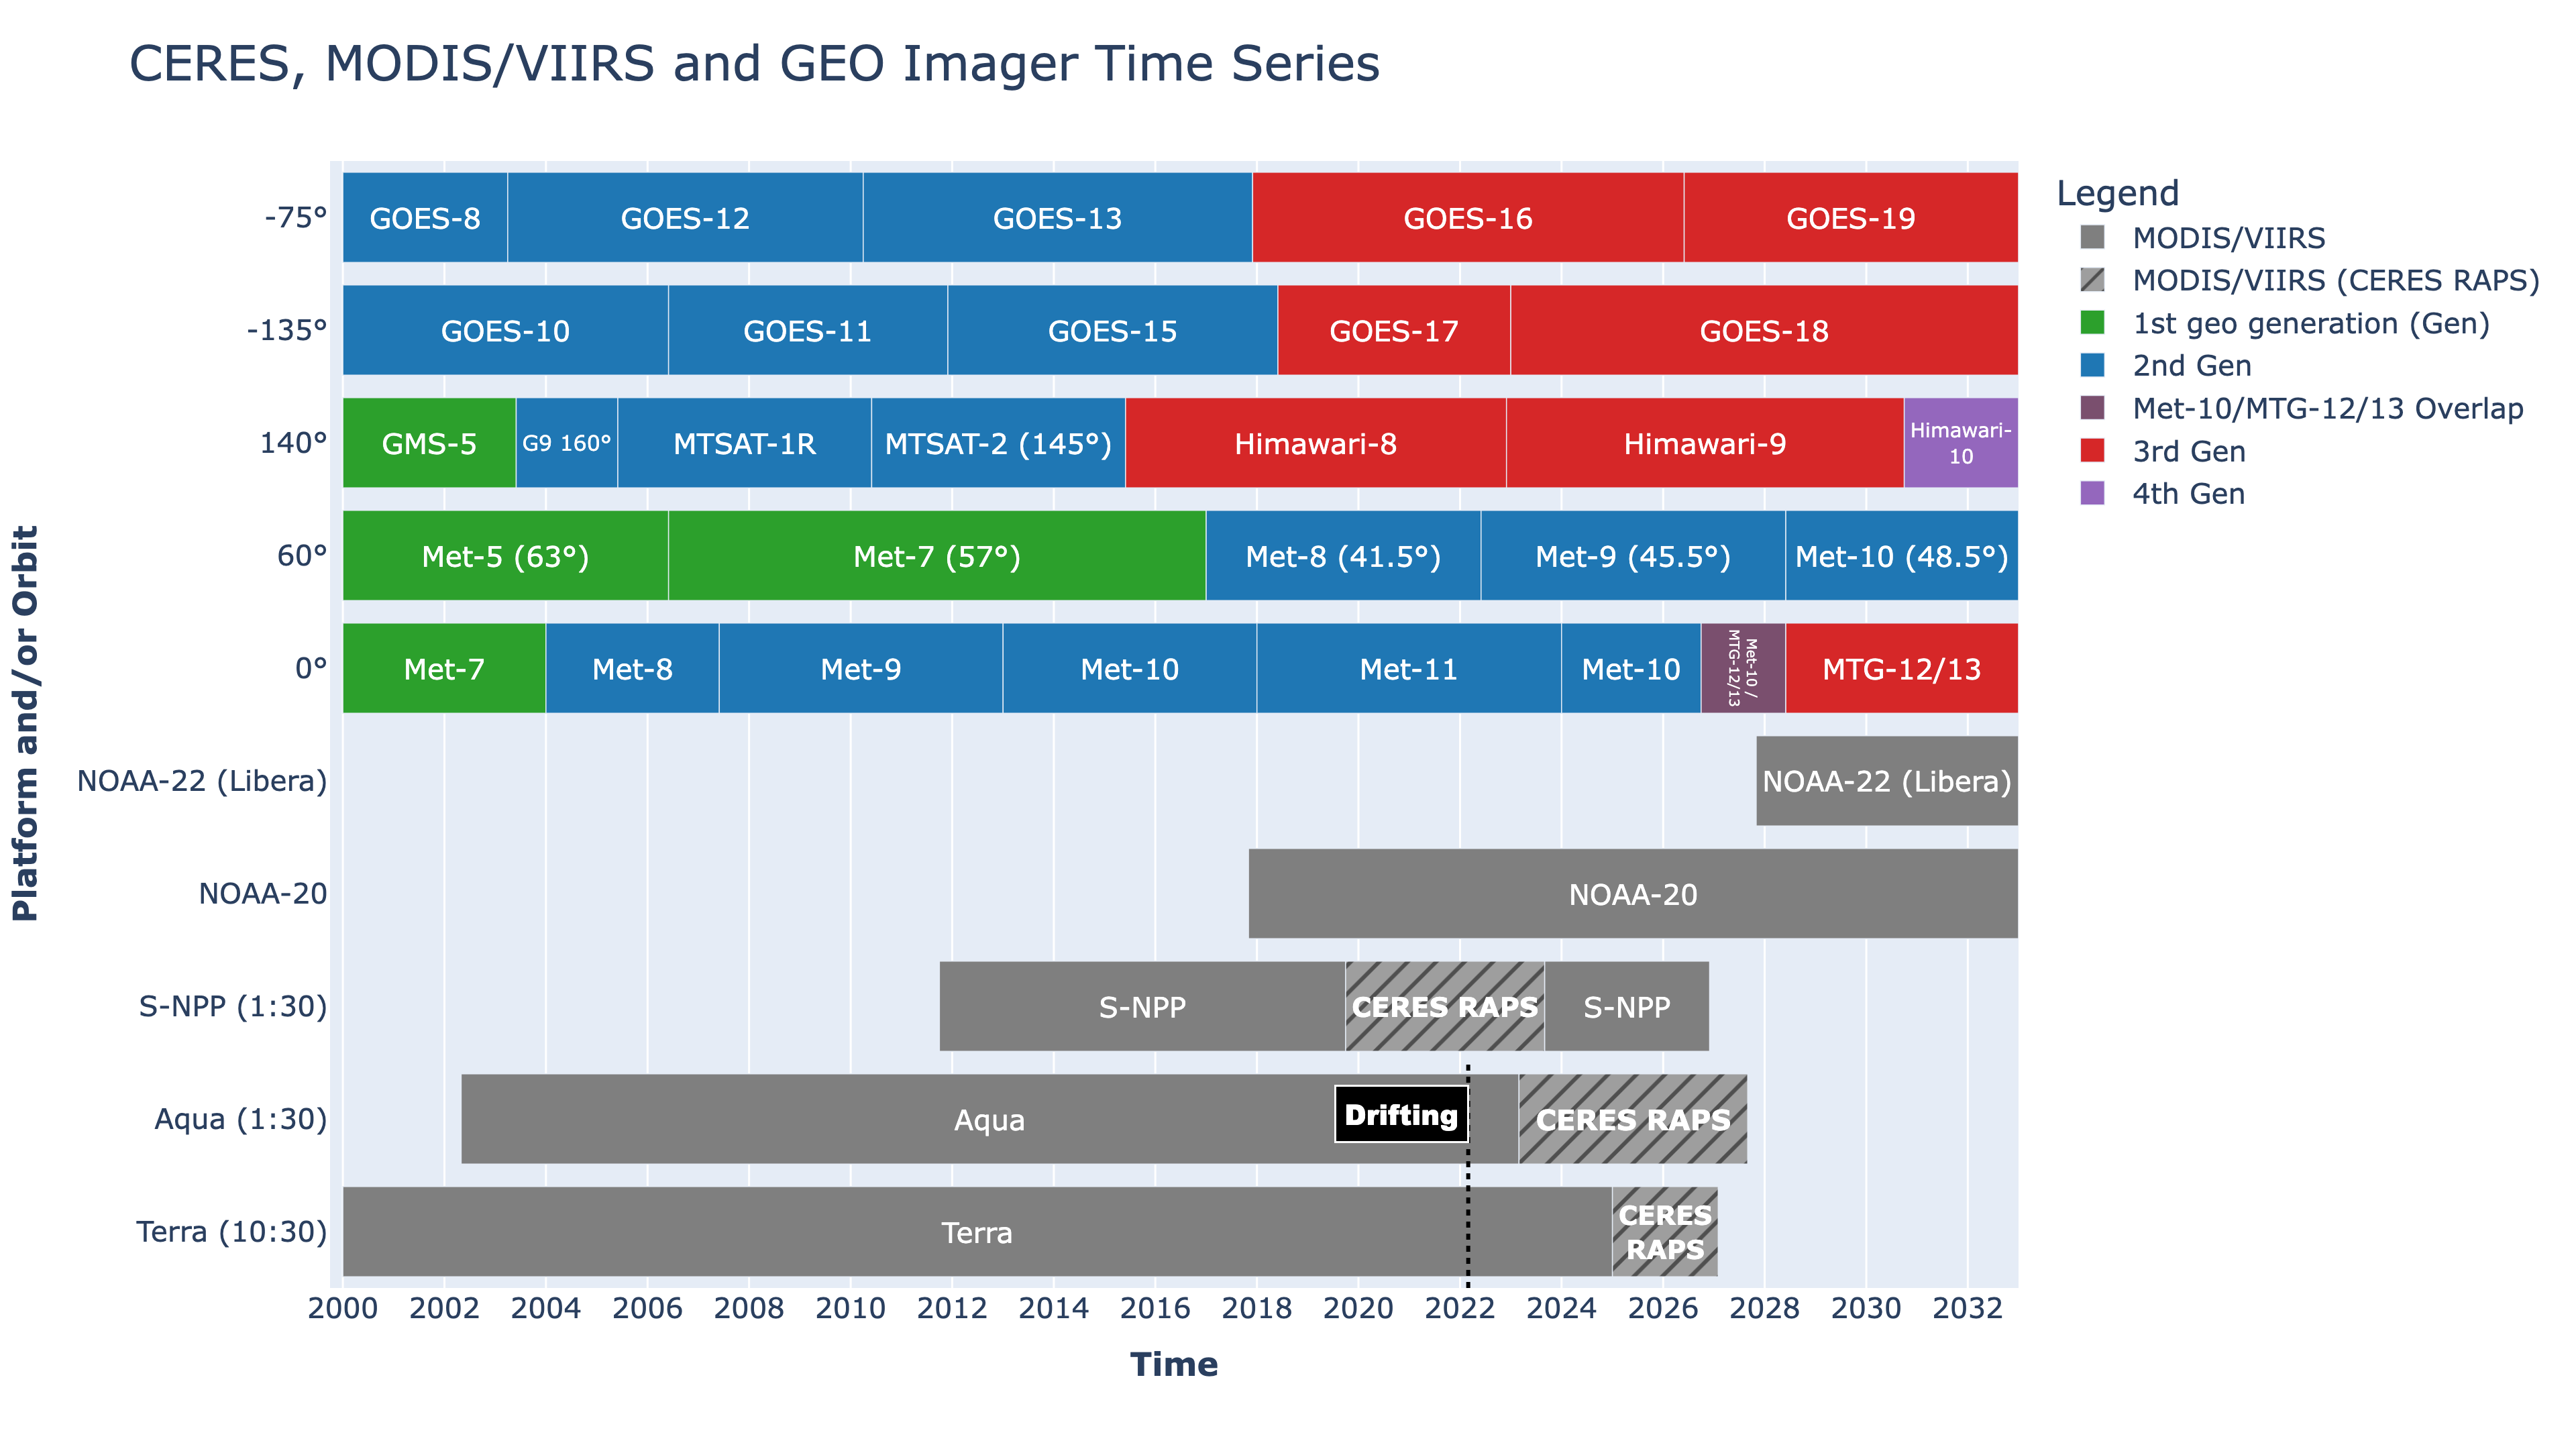
To obtain the diurnal change in radiative properties, imagers on five geostationary satellites that encircle the Earth are used to obtain hourly cloud fields from 60oN to 60o S in the Geostationary Satellite (GEO) product with the same cloud variables that are included in the SSF. The GEO cloud properties are also gridded to one-degree, and the five satellites that circle the globe are composited to provide input for the Time and Space Interpolated (TSI) intermediate product and merged with the SSF1deg-Hour. During the TSI process, narrowband-to-broadband (NB2BB) regressions are used with the geostationary imager radiances to create SW and LW fluxes for times when CERES ToA fluxes are not available. The TSI is used as input to the “SYNoptic Interpolated” (SYNI) algorithm which contains the Fu-Liou RTM to compute the SW and LW fluxes at the surface, within the atmosphere, and at the ToA. Fluxes for each region (1-degree grid) and hour of the month are obtained. The gridded-hourly observed and computed fluxes are combined into the SYN1deg and averaged to provide daily, monthly, and monthly hourly products, using hourly 1-degree gridded fields of cloud properties from multiple Low Earth Orbiting (LEO) and GEO imagers (SYN1deg-1Hour, SYN1deg-Day, SYN1deg-Month, and SYN1deg-MHour).
The GEO pixel-level cloud product and cloud information from the SSF are separated into three pressure layers and three optical depth (tau) bin for the monthly Cloud Type Histogram (CldTypHist) products.
The SSF cloud layer data is used with imager narrowband-to-broadband regression to create cloud specific fluxes for seven pressure layers and six optical depth (tau) bins in the Flux by Cloud Type (FluxByCldTyp) product. This recent addition to the CERES products has supported studies of changes in cloud types and their impact on the Earth’s radiation balance.
Finally, the SSF and GEO information are processed through separate codebases to create the Energy Balanced and Filled (EBAF) ToA product. The ToA fluxes are adjusted using Ocean Heat Content (OHC) information to be consistent for modelers. The EBAF surface uses the SYN1deg-1Hour information to provide the monthly surface fluxes and cloud-removed ToA fluxes that are combined with the EBAF TOA to produce the EBAF ToA and Surface product.
Notably, some products are created that do not contain CERES data but are essential as input to the RTM. These are the cloud properties obtained from GEO satellite imagery at the pixel level (GEO) and the Cloud Type Histogram (CldTypHist) products that are only listed in the CERES Projects page and not on the CERES instrument page.