We are in the process of migrating all NASA Earth science data sites into Earthdata from now until end of 2026. Not all NASA Earth science data and resources will appear here until then. Thank you for your patience as we make this transition.
Read about the Web Unification Project
MODIS Resources
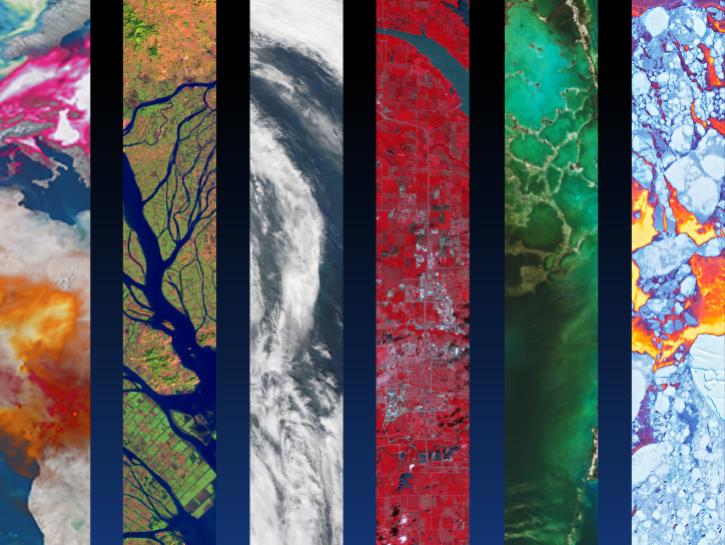
Earthdata resources for users working with NASA’s Moderate Resolution Imaging Spectroradiometer (MODIS) data include tutorials and other learning resources, news announcements such as instrument updates and data releases, user guides and related documents, and frequently asked questions.
MODIS Learning Resources
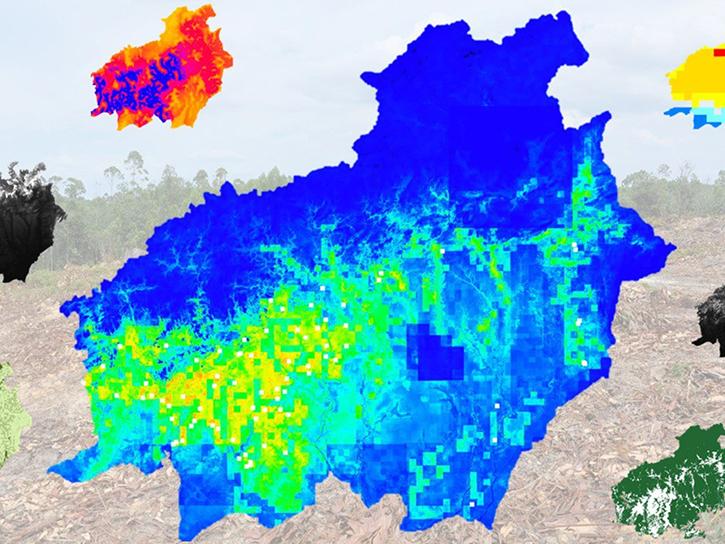
In Spring 2016, DEVELOP researchers used MODIS data to identify areas of potential palm oil production and the risks of rainforest deforestation in Indonesia.
Data in Action
June 29, 2016
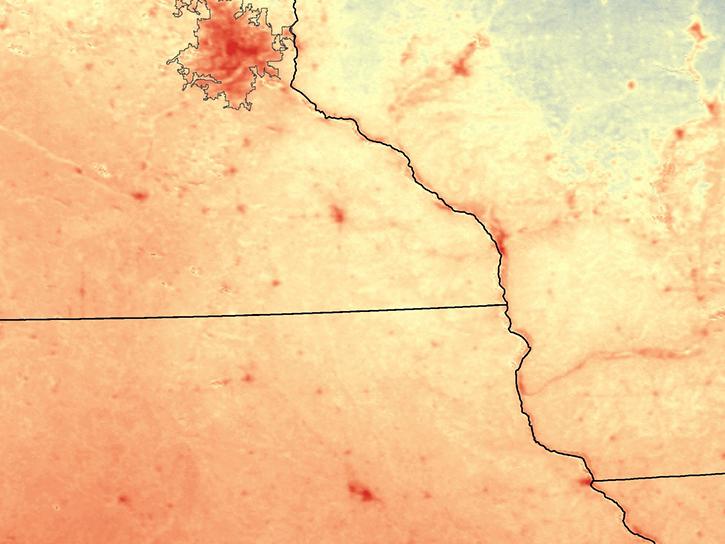
Learn how NASA MODIS data and the AppEEARS tool can be used to detect and analyze temperature differences between urban and rural areas.
Data in Action
June 22, 2016

This ARSET training provides an overview of carbon monitoring for terrestrial ecosystems.
Training
June 9 - July 7, 2016
Read stories from the 2015 issue of Sensing our Planet to learn about the many uses of MODIS data distributed by LP DAAC.
Data in Action
June 1, 2016

Learn how remote sensing helps classify minerals and identify faults, the effectiveness of an afforestation program, and assessing forests and grasslands disturbance.
Data in Action
May 20, 2016
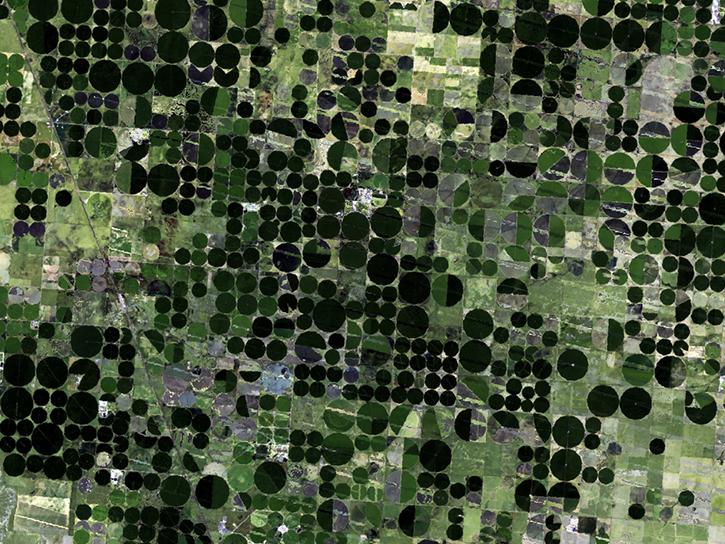
Learn about Web-Enabled Landsat Data (WELD), a MEaSUREs project that created composited mosaics of the U.S. using ETM+ data from 2002 to 2012.
Data in Action
March 31, 2016

This ARSET training provides demonstrations and hands-on experience in using NASA remote sensing observations and flood mapping tools.
Training
March 16 - April 6, 2016
Learn how MODIS data reprocessing campaigns make the data more accurate, especially for temperature estimates of error-prone land-cover types such as deserts.
Data in Action
Feb. 24, 2016
SHOWING 8 OF 222
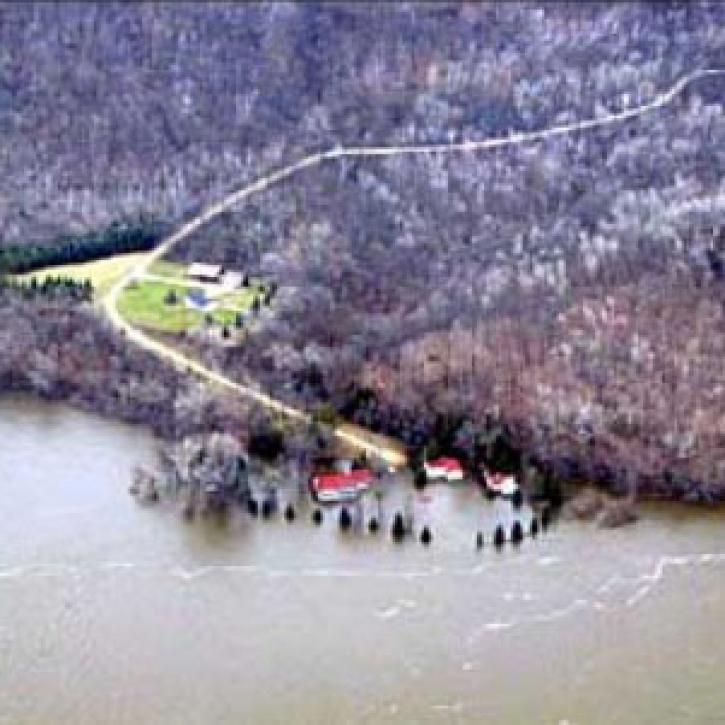
A new long-term archive of satellite data will help hydrologists monitor floods, allow aid agencies to pinpoint flood-prone regions, and provide information for modeling Earth's complex hydrologic cycles.
Feature Article
July 28, 2020
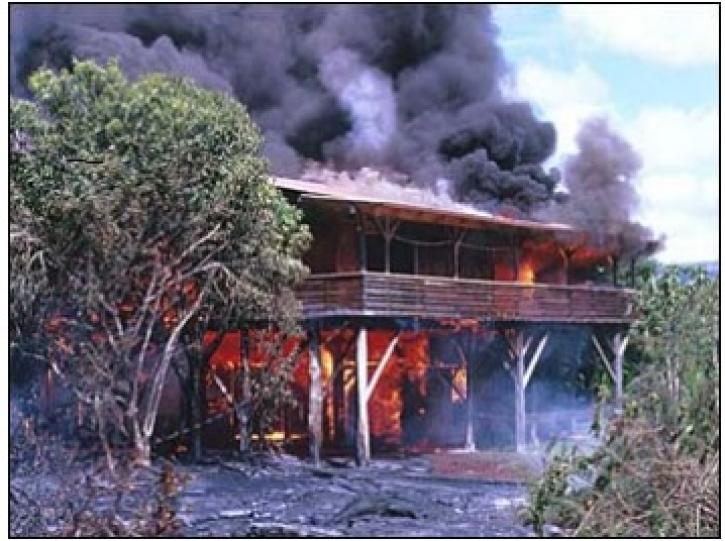
In October 2001, a volcano in the remote South Sandwich Islands began spewing ash and lava. Less than 24 hours after the eruption began, a research team nearly 9,000 miles away was estimating how much energy the volcano was producing.
Feature Article
July 28, 2020
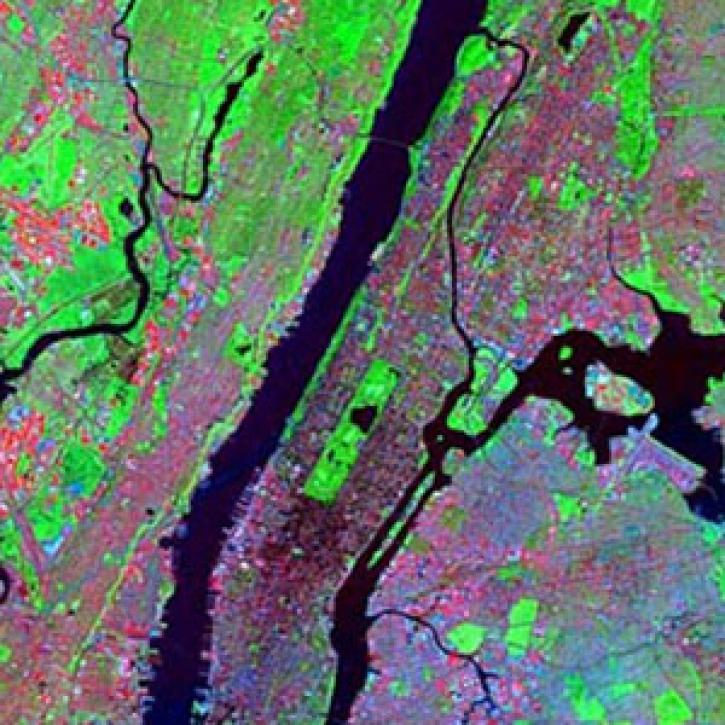
Researchers map vegetation and analyze the heat island effect in the urban landscape.
Feature Article
July 28, 2020

More than 1,750 children in the U.S. Upper Midwest had the chance to become scientists for a day thanks a program at the University of Toledo.
Feature Article
July 28, 2020
SHOWING 4 OF 527
Frequently Asked Questions
Earthdata Forum
Our online forum provides a space for users to browse thousands of FAQs about research needs, data, and data applications. You can also submit new questions for our experts to answer.
Submit Questions to Earthdata Forumand View Expert Responses