We are in the process of migrating all NASA Earth science data sites into Earthdata from now until end of 2026. Not all NASA Earth science data and resources will appear here until then. Thank you for your patience as we make this transition.
Read about the Web Unification Project
Surface Temperature Data Access and Tools
NASA has surface temperature datasets that help researchers characterize how warm air is over land and water. Access a range of data and data tools such as AppEEARS, HEG: HDF-EOS to GeoTIFF Conversion Tool, and GOES-5 Weather Maps to make the most of surface temperature data.
Surface Temperature Datasets
| Dataset Sort descending | Version | Platforms | Instruments | Temporal Extent | Spatial Extent | Spatial Resolution | Data Format |
|---|---|---|---|---|---|---|---|
| TOVS GLA MONTHLY GRIDS from NOAA-9 V01 (TOVSAMNF) at GES DISC | 01 | NOAA-9 | HIRS/2, MSU, TOVS | 1984-12-31 to 1987-01-01 |
N: 90 S: -90 E: 180 W: -180 |
||
| TOVS GLA MONTHLY GRIDS from TIROS-N 02 (TOVSAMTN) at GES DISC | 02 | TIROS-N | TOVS, HIRS/2, MSU | 1978-12-01 to 1979-12-31 |
N: 90 S: -90 E: 180 W: -180 |
||
| TOVS GLA MONTHLY GRIDS from TIROSN V01 (TOVSAMTN) at GES DISC | 01 | TIROS-N | HIRS/2, MSU, TOVS | 1978-11-30 to 1979-07-01 |
N: 90 S: -90 E: 180 W: -180 |
||
| TOVS LMD 5 DAY GRIDS from NOAA-10 V01 (TOVSB5NG) at GES DISC | 01 | NOAA-10 | HIRS/2, MSU, TOVS | 1986-12-31 to 1991-09-03 |
N: 90 S: -90 E: 180 W: -180 |
||
| TOVS LMD 5 DAY GRIDS from NOAA-12 V01 (TOVSB5ND) at GES DISC | 01 | NOAA-12 | HIRS/2, MSU, TOVS | 1991-06-29 to 1995-07-05 |
N: 90 S: -90 E: 180 W: -180 |
||
| TOVS LMD DAILY GRIDS from NOAA-10 V01 (TOVSBDNG) at GES DISC | 01 | NOAA-10 | HIRS/2, MSU, TOVS | 1986-12-31 to 1991-09-01 |
N: 90 S: -90 E: 180 W: -180 |
||
| TOVS LMD DAILY GRIDS from NOAA-12 V01 (TOVSBDND) at GES DISC | 01 | NOAA-12 | HIRS/2, MSU, TOVS | 1991-06-29 to 1995-07-05 |
N: 90 S: -90 E: 180 W: -180 |
||
| TOVS LMD MONTHLY GRIDS from NOAA-10 V01 (TOVSBMNG) at GES DISC | 01 | NOAA-10 | HIRS/2, MSU, TOVS | 1986-12-31 to 1991-09-01 |
N: 90 S: -90 E: 180 W: -180 |
||
| TOVS LMD MONTHLY GRIDS from NOAA-12 V01 (TOVSBMND) at GES DISC | 01 | NOAA-12 | HIRS/2, MSU, TOVS | 1991-06-30 to 1995-07-01 |
N: 90 S: -90 E: 180 W: -180 |
||
| TRACE-A Balloonsondes and Ozonesondes Data | 1 | RADIOSONDES | OZONESONDES | 1990-03-13 to 1992-10-26 |
N: -4.27 S: -25.9 E: 28.2 W: -56 |
GTE |
SHOWING 10 OF 969
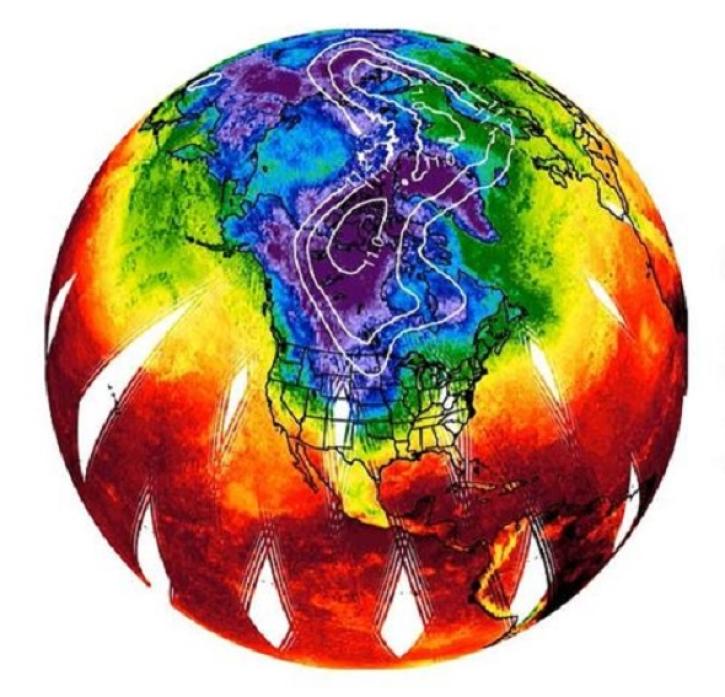
Featured Surface Temperature Observation Method: AIRS
The Atmospheric Infrared Sounder (AIRS) aboard the Aqua satellite is a hyperspectral instrument that makes daily global measurements of infrared energy reflected by Earth's surface and atmosphere. The data is used to create three-dimensional water vapor and temperature profiles throughout the atmosphere. Meteorologists and other scientists use the data to make weather forecasts and as part of the historical global temperature record.


This API allows users to visualize Atmospheric Infrared Sounder data using a Common Metadata Repository search result.

Learn how to access and visualize Atmospheric Infrared Sounder (AIRS) grid data from NASA's Goddard Earth Sciences Data and Information Services Center (GES DISC) in Python.
Next-generation instruments aboard Joint Polar Satellite System spacecraft provide continuity to the AIRS project that began in 2002.
11 MIN READ
Frequently Asked Questions
Earthdata Forum
Our online forum provides a space for users to browse thousands of FAQs about research needs, data, and data applications. You can also submit new questions for our experts to answer.
Submit Questions to Earthdata Forumand View Expert Responses