We are in the process of migrating all NASA Earth science data sites into Earthdata from now until end of 2026. Not all NASA Earth science data and resources will appear here until then. Thank you for your patience as we make this transition.
Read about the Web Unification Project
Evapotranspiration Data Access and Tools
NASA has evapotranspiration datasets that help researchers characterize how water is evaporating from land and vegetation. Access a range of data and data tools such as OpenET, AppEEARS, and Soil Moisture Visualizer to make the most of evapotranspiration data.
Evapotranspiration Datasets
SHOWING 10 OF 108
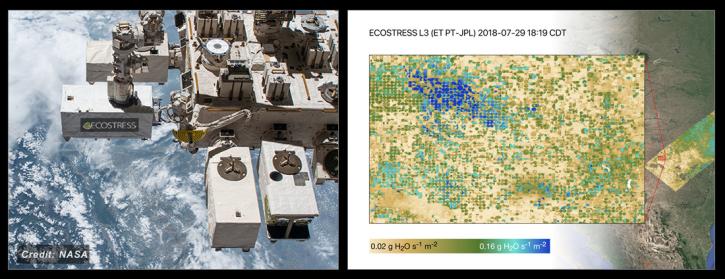
Featured Evapotranspiration Observation Method: ECOSTRESS
The ECOsystem Spaceborne Thermal Radiometer Experiment on Space Station (ECOSTRESS) instrument measures the temperature of plants across Earth to assess the loss of water through the tiny stomata pores in their leaves. This loss of water through leaves is a key component evapotranspiration. Plants regulate their temperature by releasing water through stomata. Insufficient water availability will cause the temperatures of plants to rise, which can be measured with ECOSTRESS. The instrument can scan the entire Earth in seven days and with enough detail to determine the temperature of an individual farmer's field. The data is used to create the Evaporative Stress Index (ESI), a leading drought indicator and valuable resource for decision-makers.
NASA's ECOSTRESS Mission studies how plants use water by measuring their temperature from space. Join us to learn more about ECOSTRESS mission measurements, data and tools!

The ECOSTRESS, GEDI, and OCO-3 Earth observing missions aboard the International Space Station (ISS) will help scientists better understand Earth systems.
10 MIN READ
Frequently Asked Questions
Earthdata Forum
Our online forum provides a space for users to browse thousands of FAQs about research needs, data, and data applications. You can also submit new questions for our experts to answer.
Submit Questions to Earthdata Forumand View Expert Responses