We are in the process of migrating all NASA Earth science data sites into Earthdata from now until end of 2026. Not all NASA Earth science data and resources will appear here until then. Thank you for your patience as we make this transition.
Read about the Web Unification Project
Atmospheric Rivers Data Access and Tools
From discovery to visualization, data tools such as Earthdata Search, Worldview, and Application for Extracting and Exploring Analysis Ready Samples (AppEEARS) guide users in making the most of atmospheric rivers data.
Atmospheric Rivers Datasets
| Dataset Sort descending | Version | Platforms | Instruments | Temporal Extent | Spatial Extent | Spatial Resolution | Data Format |
|---|---|---|---|---|---|---|---|
| DISCOVER-AQ Texas Deployment Analysis and Ancillary Ground Site Data | 1 | GROUND STATIONS | CAPS NO2 Analyzer, 2B Technologies, PTR-MS, CEILOMETERS, Vaisala HUMICAP HMP155, RM Young 05103 Wind Monitor, TE525 Rain Gauge | 2013-08-13 to 2016-03-14 | ICARTT | ||
| DISCOVER-AQ Texas Deployment Moody Tower Ground Site Data | 1 | GROUND STATIONS | LIDAR, Thermo Model 49C O3 Analyzer, Thermo Scientific SO2 43i Analyzer, Thermo Scientific CO Analyzer, Thermo Model 42C NO-NO2-NOx Analyzer, Thermo Scientific NOx Analyzer, RM Young 05103 Wind Monitor, HMP45C Temperature and Relative Humidity Probe | 2013-08-30 to 2013-10-02 | HDF5, ICARTT | ||
| DISCOVER-AQ Texas Deployment P-3B Aircraft In Situ Meteorological and Navigational Data | 1 | P-3B | DLH, GPS, PRESSURE TRANSDUCERS, TEMPERATURE SENSORS, HYGROMETERS | 2013-08-26 to 2013-10-01 | ICARTT | ||
| DISCOVER-AQ Texas Deployment P-3B Aircraft Merged Data Files | 1 | P-3B | Computer | 2011-06-30 to 2013-10-01 | ICARTT | ||
| DISCOVER-AQ Texas Deployment Smith Point Ground Site Data | 1 | GROUND STATIONS | MPL, 2B Technologies, 2B Technologies NO Monitor, 2B Technologies NO2 Converter, APS, TSI CPC-3010, MULTIFILTER RADIOMETER, CAPS NO2 Analyzer, TEMPERATURE SENSORS, PRESSURE SENSORS | 2013-08-27 to 2013-09-30 | HDF5, ICARTT | ||
| DISCOVER-AQ Texas Deployment Texas Commission on Environmental Quality Ground Site Data | 1 | GROUND STATIONS | GAS SENSORS, CHEMILUMINESCENCE, Teledyne API Model T200 NO/NO2/NOx Analyzer, Teledyne API Ozone Analyzer | 2013-08-13 to 2013-10-02 | ICARTT | ||
| Dynamics and Chemistry of the Summer Stratosphere Airborne Data Products | 1 | NASA ER-2, NCEP-GFS, ECMWF ERA5, GEOS-5 | MMS, UCATS-GC, DPOPS, ROZE, HWV, CANOE, CAFE, HAL, HUPCRS, Computer | 2021-06-09 to 2022-07-13 | ICARTT, NetCDF-4 | ||
| ECCO Atmosphere Surface Temperature, Humidity, Wind, and Pressure - Daily Mean 0.5 Degree (Version 4 Release 4) | V4r4 | MODELS, MITgcm | 1992-01-01 to 2018-01-01 |
N: 90 S: -90 E: 180 W: -180 |
0.5 Decimal Degrees x 0.5 Decimal Degrees | netCDF-4 | |
| ECCO Atmosphere Surface Temperature, Humidity, Wind, and Pressure - Daily Mean llc90 Grid (Version 4 Release 4) | V4r4 | MODELS, MITgcm | 1992-01-01 to 2018-01-01 |
N: 90 S: -90 E: 180 W: -180 |
1 Decimal Degrees x 1 Decimal Degrees | netCDF-4 | |
| ECCO Atmosphere Surface Temperature, Humidity, Wind, and Pressure - Monthly Mean 0.5 Degree (Version 4 Release 4) | V4r4 | MODELS, MITgcm | 1992-01-01 to 2018-01-01 |
N: 90 S: -90 E: 180 W: -180 |
0.5 Decimal Degrees x 0.5 Decimal Degrees | netCDF-4 |
SHOWING 10 OF 1007
Featured Atmospheric Rivers Observation Method: VIIRS
The Visible Infrared Imaging Radiometer Suite (VIIRS) instruments are aboard the joint NASA/NOAA Suomi National Polar-orbiting Partnership (Suomi NPP) and NOAA-platforms. The orbits of the platforms make them ideally positioned to observe atmospheric rivers reaching the west coast of North America. The VIIRS instruments include five high-resolution image bands, sixteen moderate-resolution bands, and one unique panchromatic day/night band ultra-sensitive in low-light conditions. The VIIRS instruments build on the heritage of their successful predecessors, the Advanced Very High Resolution Radiometer (AVHRR), the Moderate Resolution Imaging Spectroradiometer (MODIS), and the Sea-viewing Wide Field-of-view Sensor (SeaWIFS).
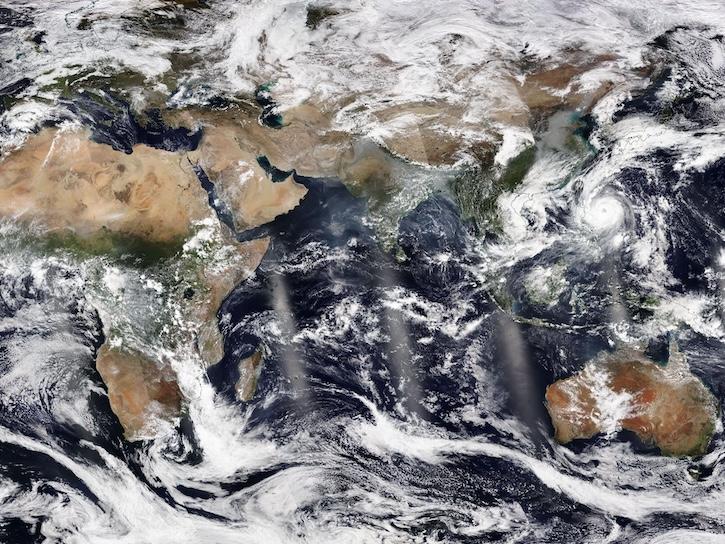
The Visible Infrared Imaging Radiometer Suite (VIIRS) will help ensure continuity of Earth observations after the upcoming retirement of the Moderate Resolution Imaging Spectroradiometer (MODIS).
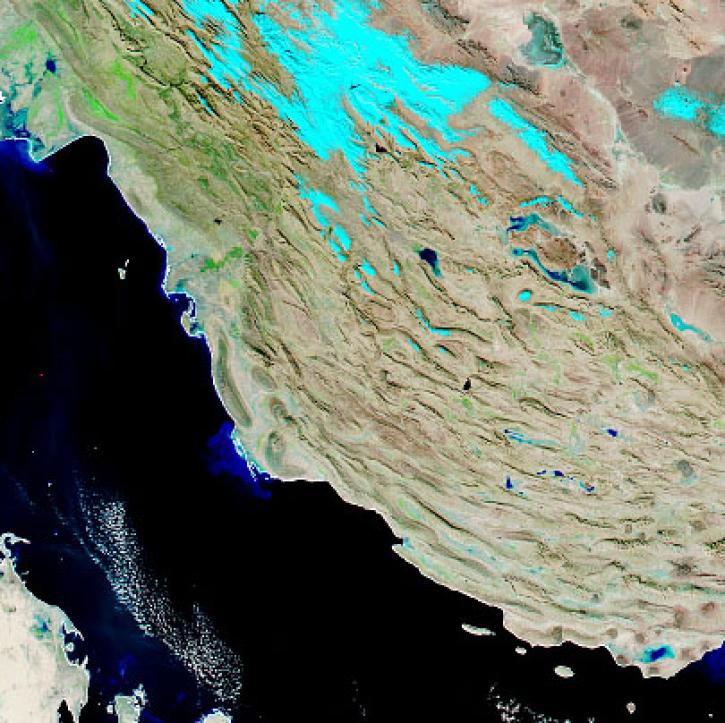
With the eventual retirement of the Terra and Aqua platforms, the Visible Infrared Imaging Radiometer Suite (VIIRS) instruments will take the lead in daily Earth observations.
19 MIN READ

Frequently Asked Questions
Earthdata Forum
Our online forum provides a space for users to browse thousands of FAQs about research needs, data, and data applications. You can also submit new questions for our experts to answer.
Submit Questions to Earthdata Forumand View Expert Responses