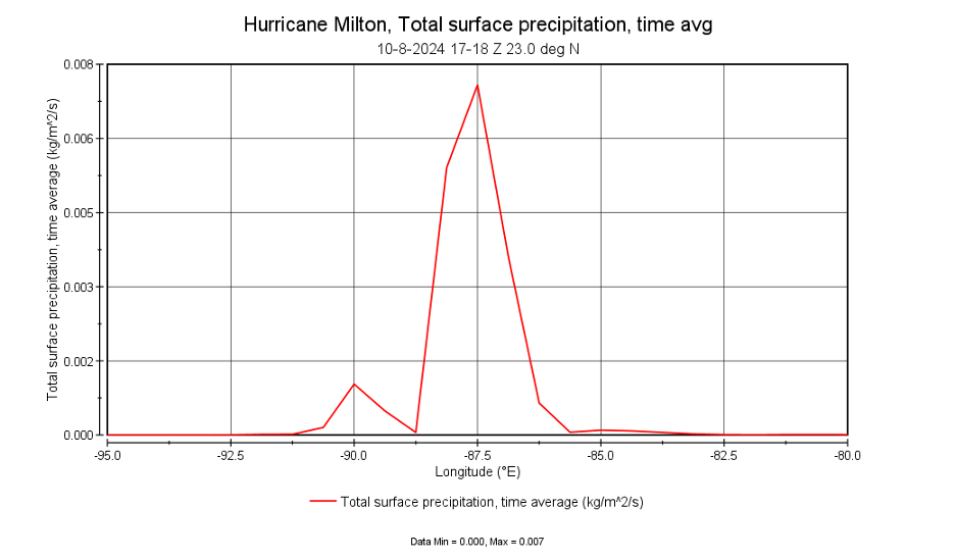
Using data from Hurricane Milton, a Category 5 hurricane that made landfall in the northern Yucatan Peninsula in October 2024, this new step-by-step tutorial demonstrates how to use Giovanni and Panoply to select data, create a data map, download the corresponding netCDF file, and create line plots. The resulting line plots provide insight for many different geophysical processes.
For example, users can learn how to create the below data map and line plot for total surface precipitation, an important metric for post-storm management, as well as other variables including total precipitable water vapor, total latent energy flux, surface northward wind, surface eastward wind, and sea level pressure.

