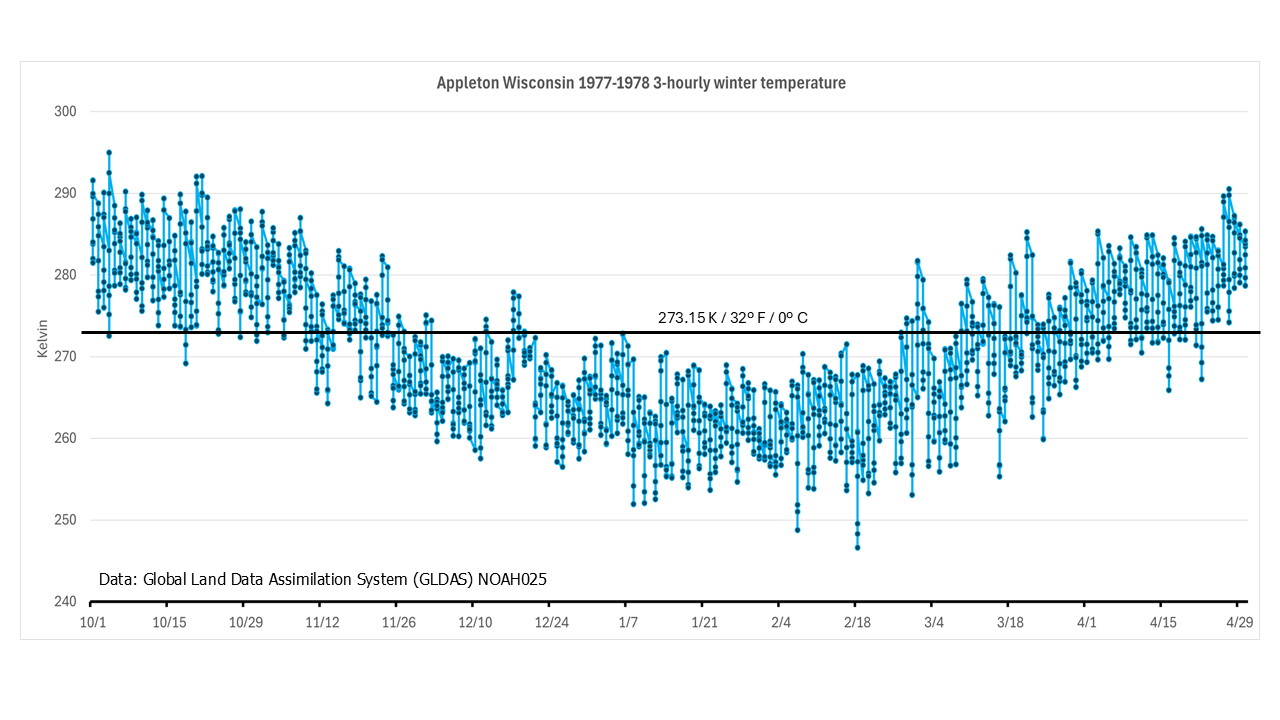
This Historical Data-in-Action article was prompted by my (perhaps fuzzy) recollection of the winter weather during my freshman year in college. My first collegiate winter (1977-1978) at Lawrence University of Wisconsin included a long period of cold weather. My memory was that Appleton set a record for consecutive days where the high temperature did not exceed 0 ºC (32º F or 273.15 K)–an interval I remembered as beginning in late November and ending in the first days of April.
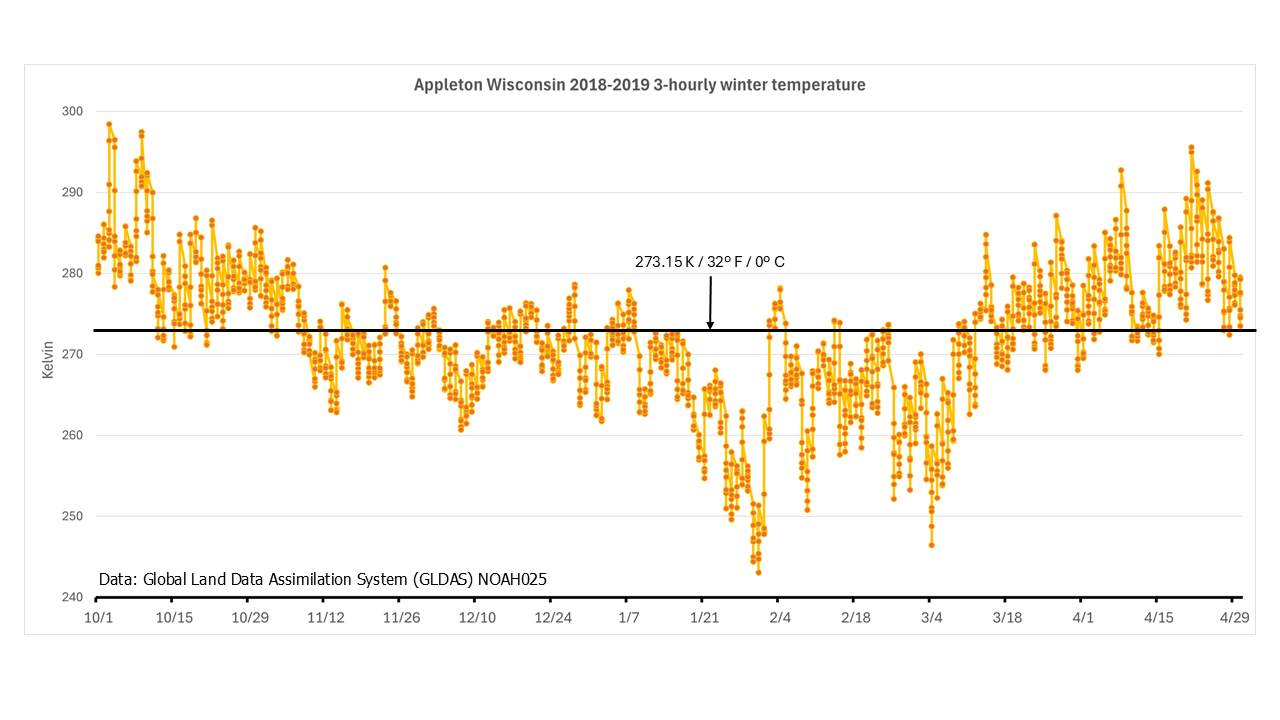
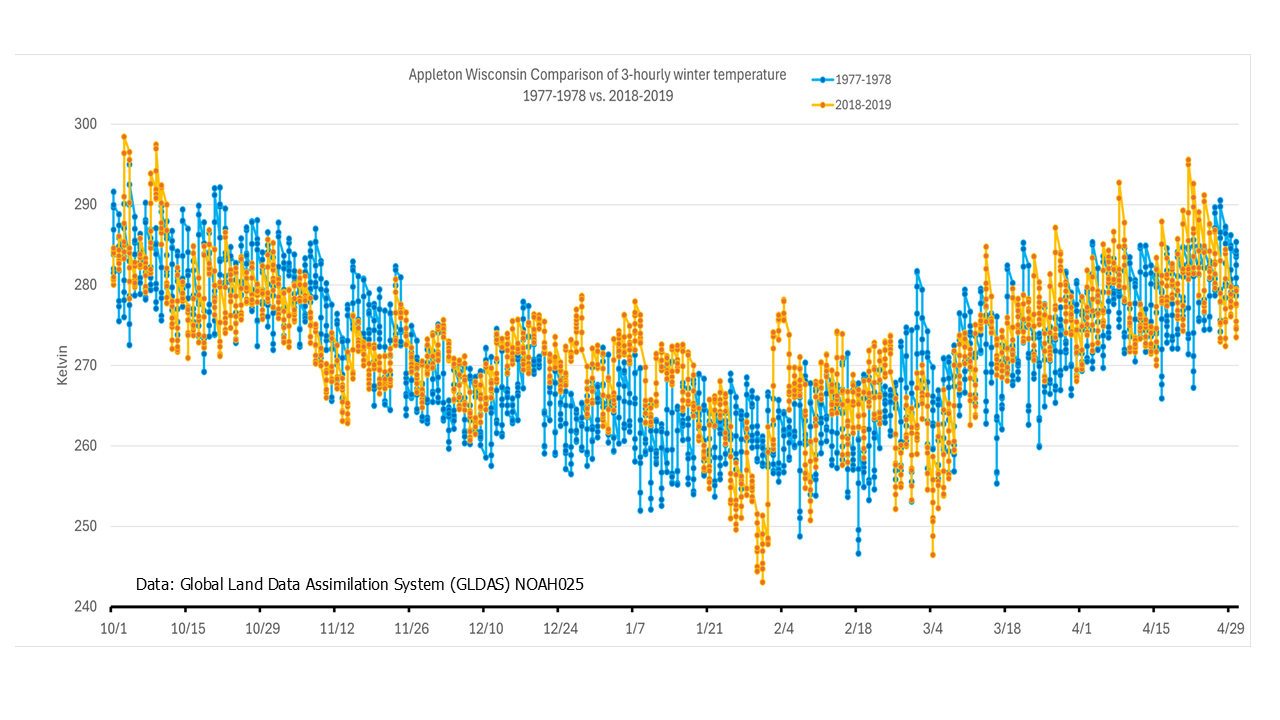
The surface temperature data from the Global Land Data Assimilation System (GLDAS) Noah hydrologic model, available in the NASA Giovanni system, provide an opportunity to check the accuracy of this chilly memory. In addition, a comparison of the surface temperatures in the winter of 1977-1978 to the winter of 2018-2019 shows how winter weather has changed. The ability to examine the accuracy of our memories allows a “reality check” on what we think is changing in our world compared to what really is changing.
Winter 1977-1978 Surface Temperatures in the Appleton, WI Region
To recreate and simulate conditions in the winter of 1977-78, we turned to GLDAS 3-hourly, near-surface air temperature data. GLDAS provides several datasets that cover different time ranges. In particular, data for the 1977-1978 winter is available in Version 2.0, which extends from 1948 to 2014. For the winter of 2018-2019, Version 2.1 data (covering 2000-2026) was used.
For these plots, an area-averaged time series was generated in Giovanni. The time-series data were downloaded as a comma-separated-variable (CSV) file and imported into an Excel spreadsheet, which was used to make the plots shown here.
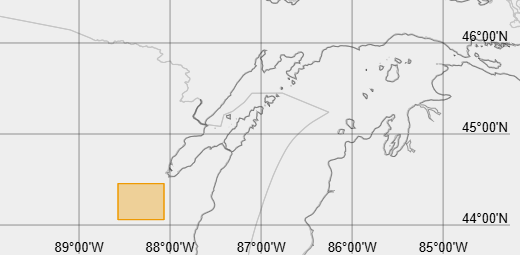
Figure 1a shows the near-surface air temperature plotted from October 1, 1977 to April 30, 1978. Figure 1b shows the bounding box used for this plot and for the data in Figure 2. I chose an area with Appleton in the northeast quadrant to reduce the potential influence of Lake Michigan. (GLDAS data have a spatial resolution of 0.25 degrees.)